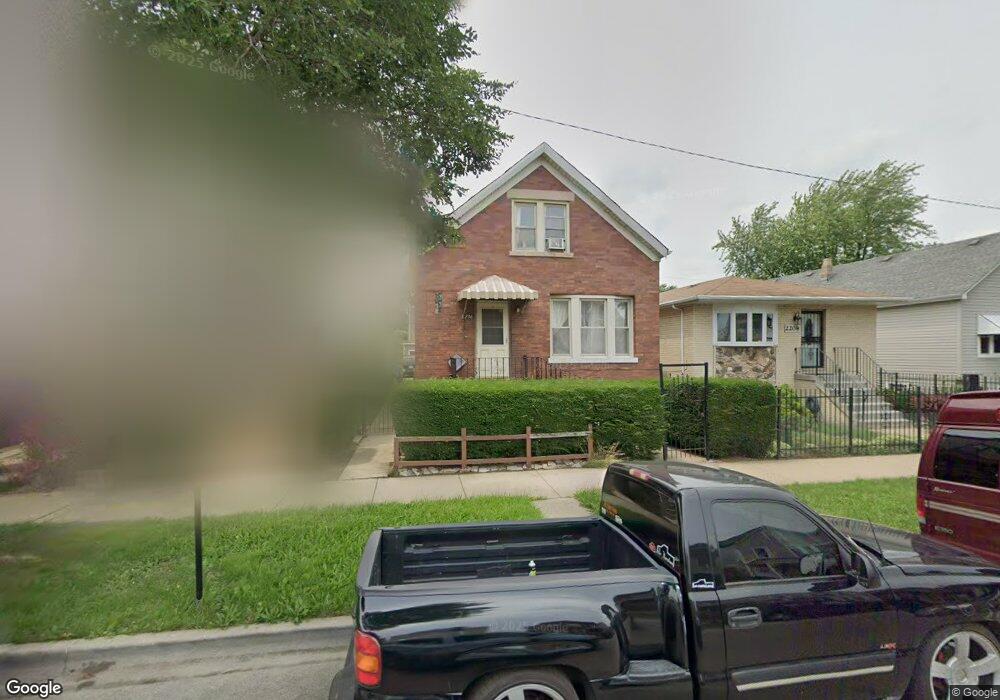
2206 N Major Ave Chicago, IL 60639
Belmont Central NeighborhoodEstimated Value: $350,104 - $423,000
4
Beds
2
Baths
1,681
Sq Ft
$237/Sq Ft
Est. Value
About This Home
This home is located at 2206 N Major Ave, Chicago, IL 60639 and is currently estimated at $397,776, approximately $236 per square foot. 2206 N Major Ave is a home located in Cook County with nearby schools including Prieto Math-Science Elementary School, Steinmetz College Prep, and CICS West Belden.
Ownership History
Date
Name
Owned For
Owner Type
Purchase Details
Closed on
Jul 23, 2004
Sold by
Bahena Gabriela
Bought by
Mora Jose Luis
Current Estimated Value
Home Financials for this Owner
Home Financials are based on the most recent Mortgage that was taken out on this home.
Original Mortgage
$244,800
Outstanding Balance
$124,532
Interest Rate
6.5%
Mortgage Type
Unknown
Estimated Equity
$273,244
Purchase Details
Closed on
Aug 18, 2001
Sold by
Murguia Alberto R
Bought by
Bahena Gabriela
Home Financials for this Owner
Home Financials are based on the most recent Mortgage that was taken out on this home.
Original Mortgage
$159,000
Interest Rate
8.5%
Purchase Details
Closed on
Jul 15, 1996
Sold by
Korabik Thaddeus E and Korabik Clara C
Bought by
Murguia Alberto R and Bahena Gabriela
Home Financials for this Owner
Home Financials are based on the most recent Mortgage that was taken out on this home.
Original Mortgage
$123,950
Interest Rate
8.43%
Mortgage Type
Balloon
Create a Home Valuation Report for This Property
The Home Valuation Report is an in-depth analysis detailing your home's value as well as a comparison with similar homes in the area
Home Values in the Area
Average Home Value in this Area
Purchase History
| Date | Buyer | Sale Price | Title Company |
|---|---|---|---|
| Mora Jose Luis | $306,000 | Multiple | |
| Bahena Gabriela | -- | Integrity Title | |
| Murguia Alberto R | $127,000 | -- |
Source: Public Records
Mortgage History
| Date | Status | Borrower | Loan Amount |
|---|---|---|---|
| Open | Mora Jose Luis | $244,800 | |
| Previous Owner | Bahena Gabriela | $159,000 | |
| Previous Owner | Murguia Alberto R | $123,950 | |
| Closed | Mora Jose Luis | $61,200 |
Source: Public Records
Tax History Compared to Growth
Tax History
| Year | Tax Paid | Tax Assessment Tax Assessment Total Assessment is a certain percentage of the fair market value that is determined by local assessors to be the total taxable value of land and additions on the property. | Land | Improvement |
|---|---|---|---|---|
| 2024 | $3,733 | $29,000 | $7,707 | $21,293 |
| 2023 | $3,618 | $21,000 | $6,249 | $14,751 |
| 2022 | $3,618 | $21,000 | $6,249 | $14,751 |
| 2021 | $3,555 | $21,000 | $6,249 | $14,751 |
| 2020 | $4,630 | $23,876 | $5,207 | $18,669 |
| 2019 | $4,704 | $26,827 | $5,207 | $21,620 |
| 2018 | $4,623 | $26,827 | $5,207 | $21,620 |
| 2017 | $4,344 | $23,545 | $4,582 | $18,963 |
| 2016 | $4,218 | $23,545 | $4,582 | $18,963 |
| 2015 | $3,836 | $23,545 | $4,582 | $18,963 |
| 2014 | $3,689 | $22,435 | $4,166 | $18,269 |
| 2013 | $3,605 | $22,435 | $4,166 | $18,269 |
Source: Public Records
Map
Nearby Homes
- 2314 N Mango Ave
- 2241 N Monitor Ave
- 2341 N Major Ave
- 2448 N Major Ave
- 2430 N Central Ave
- 2419 N Central Ave
- 2123 N Austin Ave
- 2119 N Mcvicker Ave
- 2531 N Major Ave
- 2103 N Long Ave
- 2206 N Lorel Ave
- 2537 N Luna Ave
- 2503 N Lotus Ave
- 2412 N Lorel Ave
- 2515 N Lotus Ave
- 1922 N Lotus Ave
- 5512 W Wrightwood Ave
- 1909 N Lorel Ave
- 1907 N Lorel Ave
- 2434 N Lorel Ave
- 2202 N Major Ave
- 2208 N Major Ave
- 2200 N Major Ave
- 2212 N Major Ave
- 2216 N Major Ave
- 2218 N Major Ave
- 2172 N Major Ave
- 2220 N Major Ave
- 2201 N Mango Ave
- 2211 N Mango Ave
- 2213 N Mango Ave
- 2209 N Major Ave
- 2170 N Major Ave
- 2217 N Mango Ave
- 2222 N Major Ave
- 2217 N Major Ave
- 2207 N Mango Ave
- 2207 N Mango Ave Unit 1
- 2205 N Major Ave
- 2205 N Major Ave