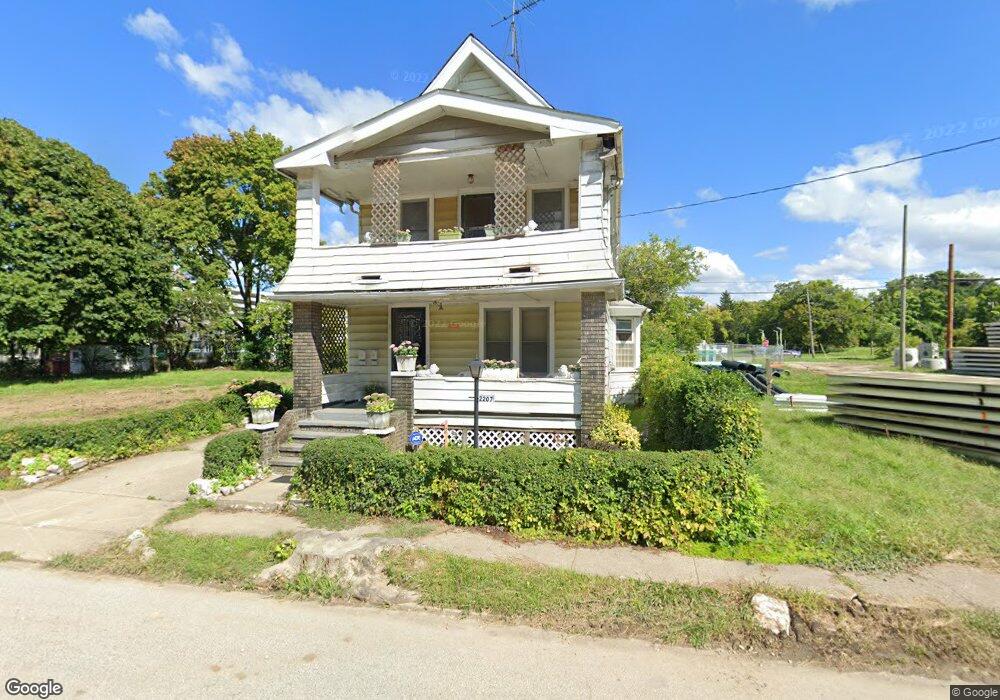
2207 E 103rd St Cleveland, OH 44106
Fairfax NeighborhoodEstimated Value: $103,891
5
Beds
2
Baths
1,873
Sq Ft
$55/Sq Ft
Est. Value
About This Home
This home is located at 2207 E 103rd St, Cleveland, OH 44106 and is currently priced at $103,891, approximately $55 per square foot. 2207 E 103rd St is a home located in Cuyahoga County with nearby schools including The Intergenerational School and St. Adalbert Catholic School.
Ownership History
Date
Name
Owned For
Owner Type
Purchase Details
Closed on
Dec 14, 2021
Sold by
Daniels Verna J
Bought by
Fairfax Renaissance Development Corporation
Current Estimated Value
Purchase Details
Closed on
Nov 4, 2021
Sold by
City Of Cleveland
Bought by
Activity Holding Llc
Purchase Details
Closed on
Oct 25, 2021
Sold by
Daniels Verna J
Bought by
City Of Cleveland
Purchase Details
Closed on
Oct 22, 2021
Sold by
Davis Renee Cansler
Bought by
City Of Cleveland
Purchase Details
Closed on
Oct 20, 2021
Sold by
Activity Holding Llc
Bought by
City Of Cleveland
Purchase Details
Closed on
Oct 8, 2021
Sold by
The Cleveland Clinic Foundation
Bought by
City Of Cleveland
Purchase Details
Closed on
Mar 28, 2005
Sold by
Daniels Herman
Bought by
Daniels Verna J
Purchase Details
Closed on
Jan 3, 1990
Sold by
Daniels Lillian M
Bought by
Daniels Herman
Purchase Details
Closed on
Jan 1, 1975
Bought by
Daniels Lillian M
Create a Home Valuation Report for This Property
The Home Valuation Report is an in-depth analysis detailing your home's value as well as a comparison with similar homes in the area
Home Values in the Area
Average Home Value in this Area
Purchase History
| Date | Buyer | Sale Price | Title Company |
|---|---|---|---|
| Fairfax Renaissance Development Corporation | -- | First American Title | |
| Activity Holding Llc | -- | None Available | |
| City Of Cleveland | -- | None Available | |
| City Of Cleveland | -- | None Available | |
| City Of Cleveland | -- | None Available | |
| City Of Cleveland | -- | None Available | |
| Daniels Verna J | -- | -- | |
| Daniels Herman | -- | -- | |
| Daniels Lillian M | -- | -- |
Source: Public Records
Tax History
| Year | Tax Paid | Tax Assessment Tax Assessment Total Assessment is a certain percentage of the fair market value that is determined by local assessors to be the total taxable value of land and additions on the property. | Land | Improvement |
|---|---|---|---|---|
| 2025 | -- | -- | -- | -- |
| 2024 | -- | -- | -- | -- |
| 2022 | $0 | $9,630 | $2,280 | $7,350 |
| 2021 | $281 | $9,630 | $2,280 | $7,350 |
| 2020 | $299 | $8,890 | $2,100 | $6,790 |
| 2019 | $277 | $25,400 | $6,000 | $19,400 |
| 2018 | $354 | $8,890 | $2,100 | $6,790 |
| 2017 | $435 | $5,220 | $1,190 | $4,030 |
| 2016 | $431 | $5,220 | $1,190 | $4,030 |
| 2015 | $621 | $5,220 | $1,190 | $4,030 |
| 2014 | $621 | $4,970 | $1,120 | $3,850 |
Source: Public Records
Map
Nearby Homes
- 2202 E 100th St
- 2294 E 100th St
- 2230 E 97th St
- 10511-10515 Frank Ave
- 2311 E 100th St
- 2321 E 101st St
- 2315 E 100th St
- 2319 E 100th St
- 2183 E 95th St
- 2296 E 97th St
- 2179 E 93rd St
- 9918 Quebec Ave
- 2288 E 95th St
- 2314 E 95th St
- 2206 E 93rd St
- 2291 E 90th St
- 2240 E 90th St
- 2292 E 90th St
- 2245 E 87th St
- 2164 E 87th St
- 2203 E 103rd St
- 2195 E 103rd St
- 2208 E 103rd St
- 2223 E 103rd St
- 2210 E 103rd St
- 2202 E 103rd St
- 2191 E 103rd St
- 2200 E 103rd St
- 2194 E 105th St
- 2196 W 103rd St
- 2196 E 103rd St
- 2227 E 103rd St
- 2220 E 105th St
- 2222 E 103rd St
- 2186 E 105th St
- 2231 E 103rd St
- 2227 E 101st St
- 2228 E 103rd St
- 2205 E 101st St
- 2184 E 105th St
Your Personal Tour Guide
Ask me questions while you tour the home.