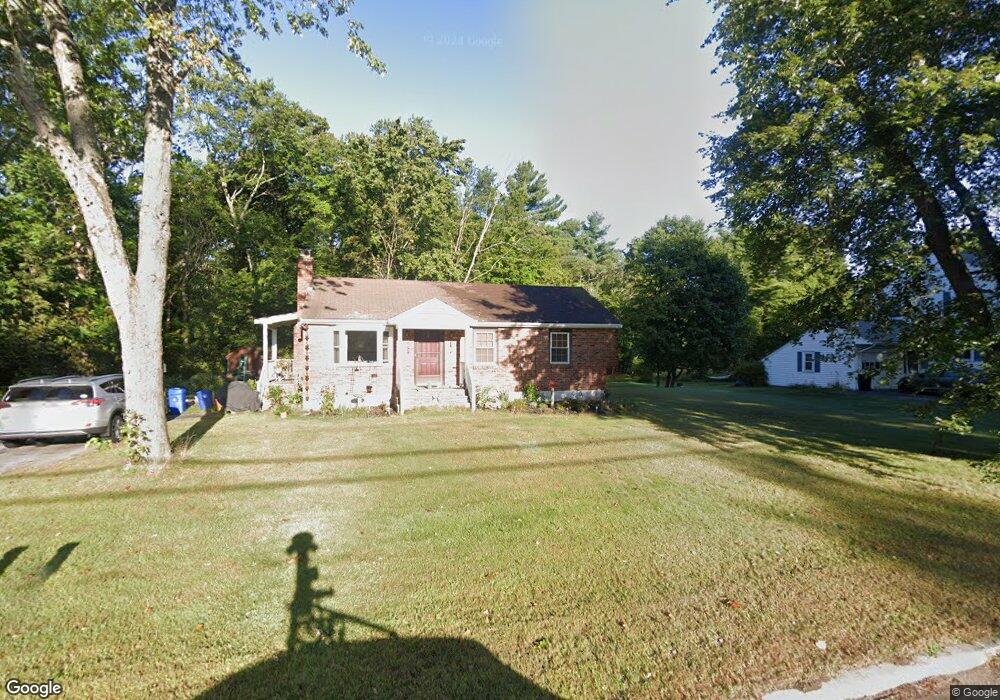
2207 Main St Unit 2207 Walpole, MA 02081
Estimated Value: $532,000 - $660,000
2
Beds
1
Bath
1,412
Sq Ft
$410/Sq Ft
Est. Value
About This Home
This home is located at 2207 Main St Unit 2207, Walpole, MA 02081 and is currently estimated at $579,120, approximately $410 per square foot. 2207 Main St Unit 2207 is a home located in Norfolk County with nearby schools including Elm Street School, Eleanor N. Johnson Middle School, and Walpole High School.
Ownership History
Date
Name
Owned For
Owner Type
Purchase Details
Closed on
Jul 24, 2012
Sold by
Burke John
Bought by
Agricola Bonnie J
Current Estimated Value
Home Financials for this Owner
Home Financials are based on the most recent Mortgage that was taken out on this home.
Original Mortgage
$199,200
Outstanding Balance
$137,700
Interest Rate
3.7%
Mortgage Type
New Conventional
Estimated Equity
$441,420
Purchase Details
Closed on
Jun 28, 2001
Sold by
Lamonica James M and Lamonica Janet C
Bought by
Burke John
Home Financials for this Owner
Home Financials are based on the most recent Mortgage that was taken out on this home.
Original Mortgage
$212,800
Interest Rate
7.14%
Mortgage Type
Purchase Money Mortgage
Create a Home Valuation Report for This Property
The Home Valuation Report is an in-depth analysis detailing your home's value as well as a comparison with similar homes in the area
Home Values in the Area
Average Home Value in this Area
Purchase History
| Date | Buyer | Sale Price | Title Company |
|---|---|---|---|
| Agricola Bonnie J | $249,000 | -- | |
| Burke John | $224,000 | -- |
Source: Public Records
Mortgage History
| Date | Status | Borrower | Loan Amount |
|---|---|---|---|
| Open | Agricola Bonnie J | $199,200 | |
| Previous Owner | Burke John | $208,000 | |
| Previous Owner | Burke John | $212,800 | |
| Previous Owner | Burke John | $25,000 |
Source: Public Records
Tax History Compared to Growth
Tax History
| Year | Tax Paid | Tax Assessment Tax Assessment Total Assessment is a certain percentage of the fair market value that is determined by local assessors to be the total taxable value of land and additions on the property. | Land | Improvement |
|---|---|---|---|---|
| 2025 | $5,722 | $446,000 | $277,100 | $168,900 |
| 2024 | $5,541 | $419,100 | $266,400 | $152,700 |
| 2023 | $5,446 | $392,100 | $231,600 | $160,500 |
| 2022 | $5,169 | $357,500 | $214,500 | $143,000 |
| 2021 | $4,899 | $330,100 | $202,400 | $127,700 |
| 2020 | $4,809 | $320,800 | $180,900 | $139,900 |
| 2019 | $4,663 | $308,800 | $174,000 | $134,800 |
| 2018 | $4,039 | $264,500 | $158,400 | $106,100 |
| 2017 | $3,912 | $255,200 | $152,200 | $103,000 |
| 2016 | $3,997 | $256,900 | $155,000 | $101,900 |
| 2015 | $3,630 | $231,200 | $131,200 | $100,000 |
| 2014 | $3,472 | $220,300 | $131,200 | $89,100 |
Source: Public Records
Map
Nearby Homes
- 375 Winter St
- 16R Eldor Dr
- 1648 Main St
- 71 Pond St
- 7 Hill St Unit 10
- 43 Chandler Ave
- 1549 Washington St Unit A
- 533 Lincoln Rd
- 12 Brookside Ln
- 13 Sandtrap Cir Unit 14
- 11 Sandtrap Cir Unit 15
- 20 Sandtrap Cir Unit 4
- 18 Sandtrap Cir Unit 3
- 17 Sandtrap Cir Unit 12
- 15 Sandtrap Cir Unit 13
- 1391 Main St Unit 304
- 1391 Main St Unit 208
- 1391 Main St Unit 305
- 1391 Main St Unit 308
- 2 Diamond St