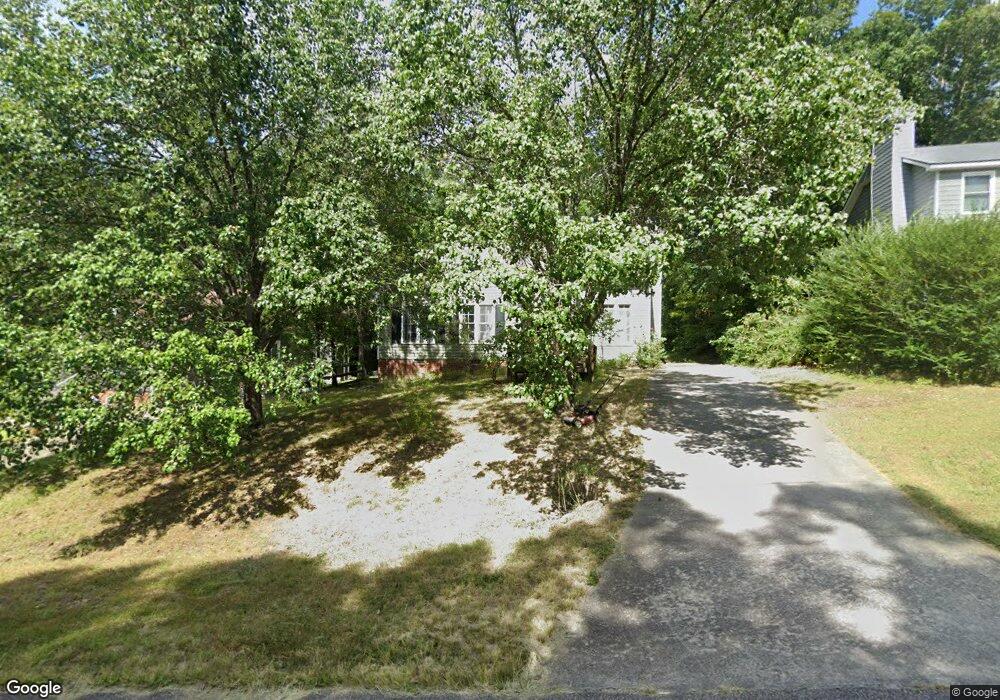
2208 Bufflehead Rd Raleigh, NC 27616
Estimated Value: $278,000 - $296,765
3
Beds
2
Baths
1,216
Sq Ft
$236/Sq Ft
Est. Value
About This Home
This home is located at 2208 Bufflehead Rd, Raleigh, NC 27616 and is currently estimated at $286,691, approximately $235 per square foot. 2208 Bufflehead Rd is a home located in Wake County with nearby schools including Forestville Road Elementary School, Neuse River Middle School, and Knightdale High.
Ownership History
Date
Name
Owned For
Owner Type
Purchase Details
Closed on
Jun 19, 2012
Sold by
Mallard Crossing Homeowners Assn Inc
Bought by
Block Sophia N
Current Estimated Value
Purchase Details
Closed on
Jul 28, 2011
Sold by
Block Sophia N
Bought by
Mallard Crossing Homeowners Association
Purchase Details
Closed on
Jan 8, 2008
Sold by
Robbins Trudy C
Bought by
Block Sophia N
Home Financials for this Owner
Home Financials are based on the most recent Mortgage that was taken out on this home.
Original Mortgage
$92,800
Interest Rate
6.06%
Mortgage Type
Purchase Money Mortgage
Purchase Details
Closed on
Feb 25, 1999
Sold by
Holland Graham T
Bought by
Robbins Trudy C
Home Financials for this Owner
Home Financials are based on the most recent Mortgage that was taken out on this home.
Original Mortgage
$100,000
Interest Rate
6.84%
Create a Home Valuation Report for This Property
The Home Valuation Report is an in-depth analysis detailing your home's value as well as a comparison with similar homes in the area
Home Values in the Area
Average Home Value in this Area
Purchase History
| Date | Buyer | Sale Price | Title Company |
|---|---|---|---|
| Block Sophia N | -- | None Available | |
| Mallard Crossing Homeowners Association | $2,381 | None Available | |
| Block Sophia N | $116,000 | None Available | |
| Robbins Trudy C | $98,500 | -- |
Source: Public Records
Mortgage History
| Date | Status | Borrower | Loan Amount |
|---|---|---|---|
| Previous Owner | Block Sophia N | $92,800 | |
| Previous Owner | Robbins Trudy C | $100,000 |
Source: Public Records
Tax History Compared to Growth
Tax History
| Year | Tax Paid | Tax Assessment Tax Assessment Total Assessment is a certain percentage of the fair market value that is determined by local assessors to be the total taxable value of land and additions on the property. | Land | Improvement |
|---|---|---|---|---|
| 2025 | $1,733 | $267,766 | $80,000 | $187,766 |
| 2024 | $1,683 | $267,766 | $80,000 | $187,766 |
| 2023 | $1,278 | $161,289 | $35,000 | $126,289 |
| 2022 | $1,185 | $161,289 | $35,000 | $126,289 |
| 2021 | $1,153 | $161,289 | $35,000 | $126,289 |
| 2020 | $1,135 | $161,289 | $35,000 | $126,289 |
| 2019 | $1,046 | $125,570 | $38,000 | $87,570 |
| 2018 | $962 | $125,570 | $38,000 | $87,570 |
| 2017 | $913 | $125,570 | $38,000 | $87,570 |
| 2016 | $895 | $125,570 | $38,000 | $87,570 |
| 2015 | $854 | $120,052 | $28,000 | $92,052 |
| 2014 | -- | $120,052 | $28,000 | $92,052 |
Source: Public Records
Map
Nearby Homes
- 4317 Snow Goose Ct
- 4208 Bluewing Rd
- 2028 Ruddy Rd
- 4457 Labrador Dr
- 4004 Mount Moran Rd
- 3917 Mount Moran Rd
- 3932 Mount Moran Rd
- 7817 Elmshire Way
- 7727 Weathered Oak Way
- 7725 Weathered Oak Way
- 7661 Mapleshire Dr
- 2616 Lizei St
- 4356 Coldwater Springs Dr
- 4348 Coldwater Springs Dr
- 7636 Birchmoor Way
- 4344 Coldwater Springs Dr
- 4345 Coldwater Springs Dr
- 7454 Randshire Way
- 4340 Coldwater Springs Dr
- 7613 Oakberry Dr
- 2212 Bufflehead Rd
- 2204 Bufflehead Rd
- 2216 Bufflehead Rd
- 2209 Bufflehead Rd
- 4301 Scaup Ct
- 2201 Bufflehead Rd
- 4305 Scaup Ct
- 2224 Bufflehead Rd
- 4309 Scaup Ct
- 2121 Bufflehead Rd
- 2228 Bufflehead Rd
- 4300 Scaup Ct
- 4324 Labrador Dr
- 4313 Scaup Ct
- 4308 Scaup Ct
- 4209 Loon Ln
- 4205 Loon Ln
- 4312 Scaup Ct
- 4317 Scaup Ct
- 4316 Scaup Ct