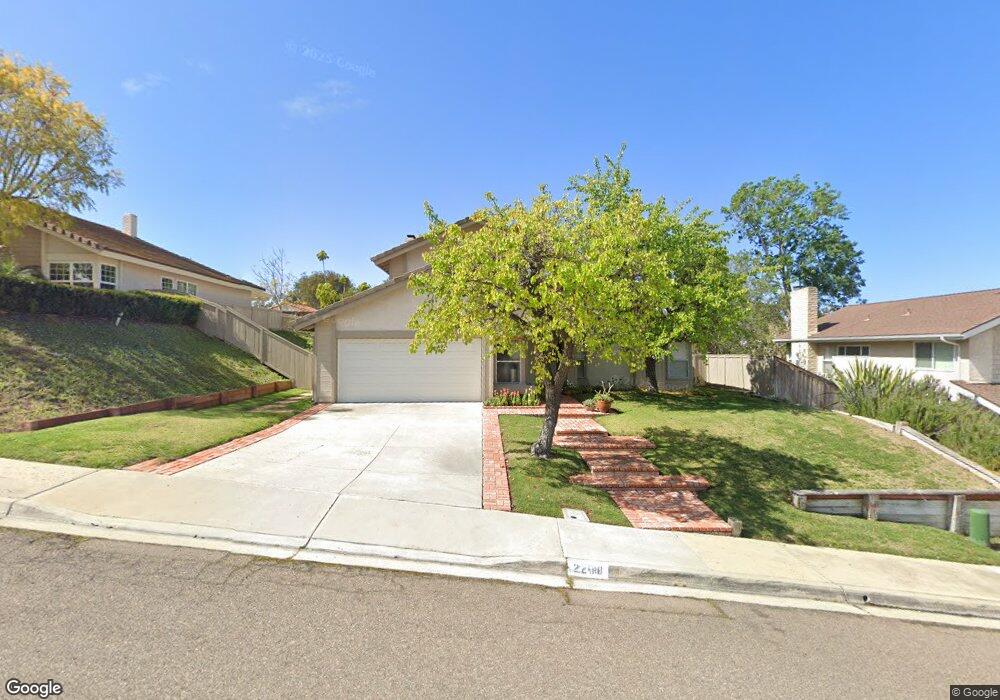
2208 Coolngreen Way Encinitas, CA 92024
Central Encinitas NeighborhoodEstimated Value: $1,615,000 - $2,095,000
4
Beds
3
Baths
2,082
Sq Ft
$864/Sq Ft
Est. Value
About This Home
This home is located at 2208 Coolngreen Way, Encinitas, CA 92024 and is currently estimated at $1,798,727, approximately $863 per square foot. 2208 Coolngreen Way is a home located in San Diego County with nearby schools including Flora Vista Elementary, Diegueno Middle School, and La Costa Canyon High School.
Ownership History
Date
Name
Owned For
Owner Type
Purchase Details
Closed on
Mar 17, 2020
Sold by
Hull Susan E
Bought by
Hull Susan E and The Susan E Hull Trust
Current Estimated Value
Purchase Details
Closed on
Jun 11, 2009
Sold by
Hull Susan Elizabeth
Bought by
Hull Susan E
Home Financials for this Owner
Home Financials are based on the most recent Mortgage that was taken out on this home.
Original Mortgage
$297,400
Interest Rate
4.44%
Mortgage Type
New Conventional
Purchase Details
Closed on
Jan 28, 2002
Sold by
Hull Ronald Craig
Bought by
Hull Susan Elizabeth
Home Financials for this Owner
Home Financials are based on the most recent Mortgage that was taken out on this home.
Original Mortgage
$199,000
Interest Rate
7.15%
Create a Home Valuation Report for This Property
The Home Valuation Report is an in-depth analysis detailing your home's value as well as a comparison with similar homes in the area
Home Values in the Area
Average Home Value in this Area
Purchase History
| Date | Buyer | Sale Price | Title Company |
|---|---|---|---|
| Hull Susan E | -- | None Available | |
| Hull Susan E | -- | Ticor Title Company | |
| Hull Susan Elizabeth | -- | Old Republic Title Company |
Source: Public Records
Mortgage History
| Date | Status | Borrower | Loan Amount |
|---|---|---|---|
| Closed | Hull Susan E | $297,400 | |
| Closed | Hull Susan Elizabeth | $199,000 |
Source: Public Records
Tax History
| Year | Tax Paid | Tax Assessment Tax Assessment Total Assessment is a certain percentage of the fair market value that is determined by local assessors to be the total taxable value of land and additions on the property. | Land | Improvement |
|---|---|---|---|---|
| 2025 | $3,101 | $244,341 | $101,898 | $142,443 |
| 2024 | $3,101 | $239,550 | $99,900 | $139,650 |
| 2023 | $2,981 | $234,854 | $97,942 | $136,912 |
| 2022 | $2,887 | $230,250 | $96,022 | $134,228 |
| 2021 | $2,817 | $225,737 | $94,140 | $131,597 |
| 2020 | $2,753 | $223,423 | $93,175 | $130,248 |
| 2019 | $2,702 | $219,044 | $91,349 | $127,695 |
| 2018 | $2,667 | $214,750 | $89,558 | $125,192 |
| 2017 | $2,625 | $210,540 | $87,802 | $122,738 |
| 2016 | $2,551 | $206,413 | $86,081 | $120,332 |
| 2015 | $2,489 | $203,313 | $84,788 | $118,525 |
| 2014 | $2,416 | $199,332 | $83,128 | $116,204 |
Source: Public Records
Map
Nearby Homes
- 905 Olive Crest Dr
- 2037 Countrywood Way
- 1825 Hummock Ln
- 1986 Azure Way Unit 107
- 324 Countrywood Ln
- 1990 Avenida la Posta
- 1971 Azure Way
- 824 Glen Arbor Dr
- 1842 Avenida Mimosa
- 1830 Gatepost Rd
- 1105 Catania Ct Unit 201
- 804 & 814 Clark Ave
- 3736 38 Via Rancho Michelle
- 200 202 Neptune Ave
- 772 Conestoga Ct
- 250 258 Hillcrest Dr
- 3424 Camino Alegre Unit 1
- 1824 Eastwood Ln
- 3224 Avenida la Cima
- 1733 Gentle Breeze Ln
- 2204 Coolngreen Way
- 2212 Coolngreen Way
- 2119 Softwind Ln
- 507 Tranquil Ct
- 2115 Softwind Ln
- 2216 Coolngreen Way
- 2200 Coolngreen Way Unit 2
- 2209 Coolngreen Way
- 2205 Coolngreen Way
- 2213 Coolngreen Way
- 503 Tranquil Ct Unit 2
- 2123 Softwind Ln
- 2201 Coolngreen Way
- 2220 Coolngreen Way
- 2111 Softwind Ln
- 2132 Coolngreen Way
- 2217 Coolngreen Way
- 5067 Tranq Way Unit 101
- 2135 Coolngreen Way
- 500 Tranquil Ct
Your Personal Tour Guide
Ask me questions while you tour the home.