2208 Holke Ct Independence, MO 64057
Blackburn NeighborhoodEstimated Value: $216,212 - $258,000
2
Beds
1
Bath
1,468
Sq Ft
$157/Sq Ft
Est. Value
About This Home
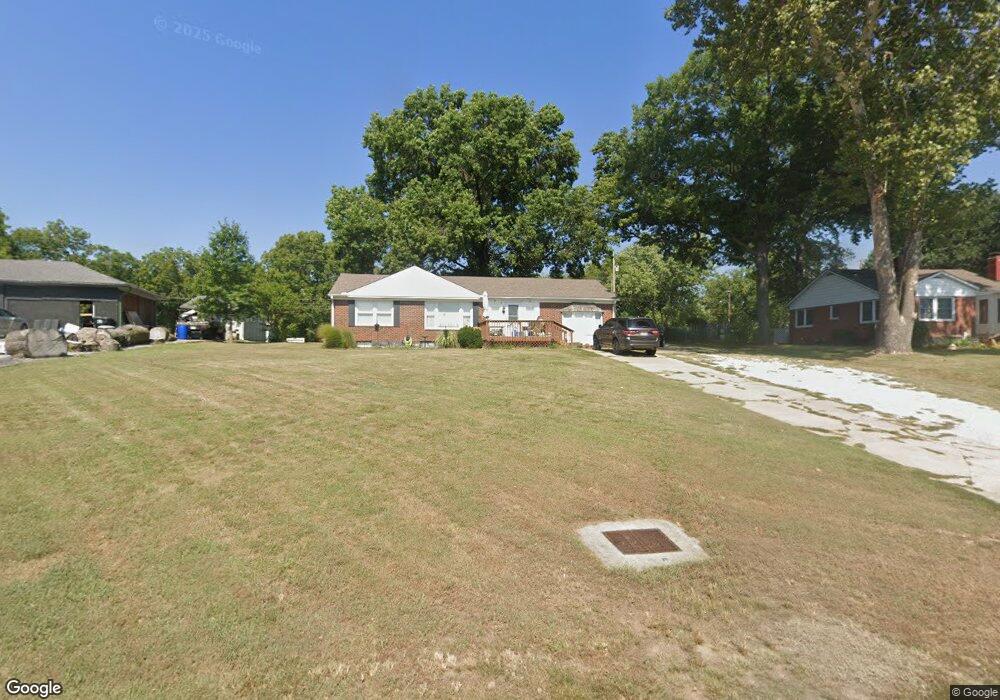
This home is located at 2208 Holke Ct, Independence, MO 64057 and is currently estimated at $229,803, approximately $156 per square foot. 2208 Holke Ct is a home located in Jackson County with nearby schools including LITTLE BLUE ELEM., Bridger Middle School, and Pioneer Ridge Middle School.
Ownership History
Date
Name
Owned For
Owner Type
Purchase Details
Closed on
Nov 15, 2019
Sold by
Lynam Rylan and Lynam Michelle
Bought by
Browning Dennis and Browning Becky Jo
Current Estimated Value
Purchase Details
Closed on
Sep 24, 2009
Sold by
Wittmeyer Larry E and Caton Bryan K
Bought by
Lynam Rylan
Home Financials for this Owner
Home Financials are based on the most recent Mortgage that was taken out on this home.
Original Mortgage
$101,134
Interest Rate
5.12%
Mortgage Type
FHA
Purchase Details
Closed on
Jan 15, 2009
Sold by
Bank Of New York
Bought by
Wittmeyer Larry E and Caton Bryan K
Purchase Details
Closed on
Aug 19, 2008
Sold by
Bachtel Maria and Bachtel Scott
Bought by
Bank Of New York and Certificate Holders Of Cwalt Inc Alterna
Purchase Details
Closed on
Apr 11, 2005
Sold by
Watson Alan W and Watson Sheri
Bought by
Bachtel Scott and Bachtel Maria
Home Financials for this Owner
Home Financials are based on the most recent Mortgage that was taken out on this home.
Original Mortgage
$104,800
Interest Rate
5.93%
Mortgage Type
Fannie Mae Freddie Mac
Create a Home Valuation Report for This Property
The Home Valuation Report is an in-depth analysis detailing your home's value as well as a comparison with similar homes in the area
Home Values in the Area
Average Home Value in this Area
Purchase History
| Date | Buyer | Sale Price | Title Company |
|---|---|---|---|
| Browning Dennis | -- | Chicago Title Company Llc | |
| Lynam Rylan | -- | Chicago Title | |
| Wittmeyer Larry E | -- | First American Title Co | |
| Bank Of New York | $82,025 | None Available | |
| Bachtel Scott | -- | Stewart Title |
Source: Public Records
Mortgage History
| Date | Status | Borrower | Loan Amount |
|---|---|---|---|
| Previous Owner | Lynam Rylan | $101,134 | |
| Previous Owner | Bachtel Scott | $104,800 | |
| Closed | Bachtel Scott | $26,200 |
Source: Public Records
Tax History
| Year | Tax Paid | Tax Assessment Tax Assessment Total Assessment is a certain percentage of the fair market value that is determined by local assessors to be the total taxable value of land and additions on the property. | Land | Improvement |
|---|---|---|---|---|
| 2025 | $1,742 | $28,907 | $8,890 | $20,017 |
| 2024 | $1,702 | $25,137 | $9,869 | $15,268 |
| 2023 | $1,702 | $25,137 | $1,566 | $23,571 |
| 2022 | $1,768 | $23,940 | $3,460 | $20,480 |
| 2021 | $1,768 | $23,940 | $3,460 | $20,480 |
| 2020 | $1,586 | $20,873 | $3,460 | $17,413 |
| 2019 | $1,561 | $20,873 | $3,460 | $17,413 |
| 2018 | $1,423 | $18,166 | $3,011 | $15,155 |
| 2016 | $1,401 | $17,711 | $6,458 | $11,253 |
Source: Public Records
Map
Nearby Homes
- 2309 S Heartland Ct
- 20204 E 23rd Ter Ct S
- 2200 Quail Dr
- 18801 E 24th Terrace S
- 2805 Castle Dr
- 20108 E 12th Terrace S
- 2431 S Ponca Ave
- 18608 E 26th Terrace S
- 20904 E 13th Terrace Ct S
- 20118 E Truman Rd
- 2829 Trenchard Dr
- 2916 Sweet Briar Dr
- 20802 E 13th Terrace S
- 18401 E 26th Street Ct S
- 933 S Kisner Dr
- 20602 E Truman Rd N
- 2944 Iva Ct
- 655 S Ranson St
- 907 S Jones Rd
- 801 S Butler Ln
- 2208 Holke Ct
- 2212 Holke Ct
- 2204 Holke Ct
- 2216 E Necessary Rd
- 2216 Holke Ct
- 2122 Holke Rd
- 2122 S Jackson Dr
- 2112 S Jackson Dr
- 2110 Holke Rd
- 2227 Holke Rd
- 19708 Holke Rd
- 19704 Holke Rd
- 2106 S Jackson Dr
- 19700 Holke Rd
- 19805 Holke Rd
- 2104 S Jackson Dr
- 2104 S Jackson Dr
- 19801 Holke Rd
- 19612 Holke Rd
- 2115 S Jackson Dr
Your Personal Tour Guide
Ask me questions while you tour the home.