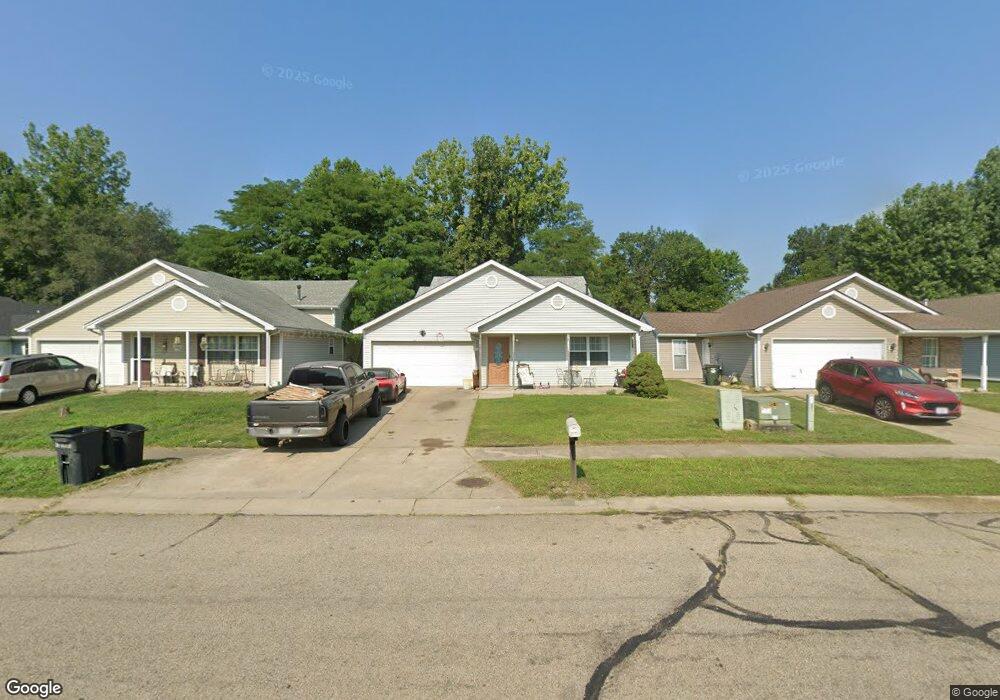
2208 Jackson Ln Middletown, OH 45044
Greenfields NeighborhoodEstimated Value: $249,000 - $264,903
3
Beds
3
Baths
2,063
Sq Ft
$125/Sq Ft
Est. Value
About This Home
This home is located at 2208 Jackson Ln, Middletown, OH 45044 and is currently estimated at $258,726, approximately $125 per square foot. 2208 Jackson Ln is a home located in Butler County with nearby schools including Mayfield Elementary School, Highview 6th Grade Center, and Middletown Middle School.
Ownership History
Date
Name
Owned For
Owner Type
Purchase Details
Closed on
Jun 29, 2018
Sold by
Martin Lesli K and Martin Ronald Ray
Bought by
Thacker Austin D
Current Estimated Value
Home Financials for this Owner
Home Financials are based on the most recent Mortgage that was taken out on this home.
Original Mortgage
$18,235
Outstanding Balance
$15,838
Interest Rate
4.6%
Mortgage Type
New Conventional
Estimated Equity
$242,888
Purchase Details
Closed on
Nov 24, 2004
Sold by
Thacker Lesli K and Martin Lesli K
Bought by
Martin Ronald Ray and Martin Lesli K
Home Financials for this Owner
Home Financials are based on the most recent Mortgage that was taken out on this home.
Original Mortgage
$111,392
Interest Rate
5.77%
Mortgage Type
Stand Alone Refi Refinance Of Original Loan
Purchase Details
Closed on
Aug 14, 1998
Sold by
Gabbard Wayne and Gabbard Mary Jo
Bought by
Thacker Lesli K
Home Financials for this Owner
Home Financials are based on the most recent Mortgage that was taken out on this home.
Original Mortgage
$114,907
Interest Rate
7.07%
Mortgage Type
FHA
Create a Home Valuation Report for This Property
The Home Valuation Report is an in-depth analysis detailing your home's value as well as a comparison with similar homes in the area
Home Values in the Area
Average Home Value in this Area
Purchase History
| Date | Buyer | Sale Price | Title Company |
|---|---|---|---|
| Thacker Austin D | $150,000 | None Available | |
| Martin Ronald Ray | -- | Transcontinental Title Co | |
| Thacker Lesli K | $115,725 | Midland Title Security Inc | |
| Gabbard Wayne | $8,250 | -- |
Source: Public Records
Mortgage History
| Date | Status | Borrower | Loan Amount |
|---|---|---|---|
| Open | Thacker Austin D | $18,235 | |
| Previous Owner | Martin Ronald Ray | $111,392 | |
| Previous Owner | Thacker Lesli K | $114,907 |
Source: Public Records
Tax History
| Year | Tax Paid | Tax Assessment Tax Assessment Total Assessment is a certain percentage of the fair market value that is determined by local assessors to be the total taxable value of land and additions on the property. | Land | Improvement |
|---|---|---|---|---|
| 2025 | $3,954 | $76,550 | $7,080 | $69,470 |
| 2024 | $3,954 | $76,550 | $7,080 | $69,470 |
| 2023 | $3,931 | $76,220 | $7,080 | $69,140 |
| 2022 | $2,869 | $49,360 | $7,080 | $42,280 |
| 2021 | $2,759 | $49,360 | $7,080 | $42,280 |
| 2020 | $2,874 | $49,360 | $7,080 | $42,280 |
| 2019 | $2,907 | $40,110 | $7,390 | $32,720 |
| 2018 | $2,530 | $40,110 | $7,390 | $32,720 |
| 2017 | $2,535 | $40,110 | $7,390 | $32,720 |
| 2016 | $2,647 | $40,110 | $7,390 | $32,720 |
| 2015 | $2,608 | $40,110 | $7,390 | $32,720 |
| 2014 | $2,115 | $40,110 | $7,390 | $32,720 |
| 2013 | $2,115 | $35,410 | $7,390 | $28,020 |
Source: Public Records
Map
Nearby Homes
- 3504 Brian Ct
- 2128 Lamberton St
- 2028 Jackson Ln
- 2013 Lamberton St
- 3746 Lacy Ct
- 3218 Keays Ave
- 1932 Winton St
- 3700 Greenwood Dr
- 3213 Selden Ave
- 1913 Brentwood St
- 3216 Beatrice Dr
- 2237 Carolina St
- 3208 Beatrice Dr
- 2216 Carolina St
- 2014 S Breiel Blvd Unit 2014
- 1808 Carolina St
- 4205 Helton Dr
- 1315 Brentwood St
- 1205 Eaton Ave
- 1700 Johns Rd
- 2204 Jackson Ln
- 2212 Jackson Ln
- 2200 Jackson Ln
- 2216 Jackson Ln
- 2128 Jackson Ln
- 2220 Jackson Ln
- 2215 Jackson Ln
- 2124 Jackson Ln
- 2201 Jackson Ln
- 2224 Jackson Ln
- 3515 Lefferson Rd
- 2219 Jackson Ln
- 2120 Jackson Ln
- 3504 Murphy Ct
- 2125 Brian Ct
- 2223 Jackson Ln
- 3505 Murphy Ct
- 0 Jackson Ln Unit 493387
- 0 Jackson Ln Unit 1257250
- 2116 Jackson Ln
Your Personal Tour Guide
Ask me questions while you tour the home.