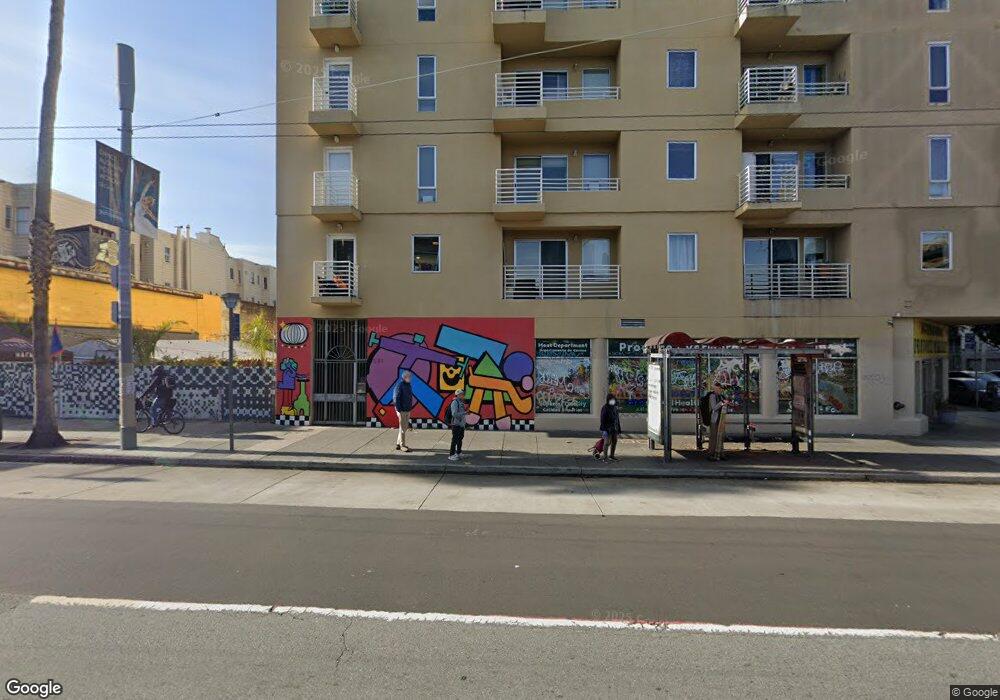
2208 Mission St Unit 304 San Francisco, CA 94110
Inner Mission NeighborhoodEstimated Value: $350,000 - $671,968
2
Beds
1
Bath
1,032
Sq Ft
$477/Sq Ft
Est. Value
About This Home
This home is located at 2208 Mission St Unit 304, San Francisco, CA 94110 and is currently estimated at $491,989, approximately $476 per square foot. 2208 Mission St Unit 304 is a home located in San Francisco County with nearby schools including Sanchez Elementary, Everett Middle School, and La Scuola International School Elementary School Campus.
Ownership History
Date
Name
Owned For
Owner Type
Purchase Details
Closed on
Aug 2, 2019
Sold by
Gulch Daniel S and Gulch Stephanie Joy
Bought by
Feng Wenhui and Lin Welyuan
Current Estimated Value
Home Financials for this Owner
Home Financials are based on the most recent Mortgage that was taken out on this home.
Original Mortgage
$161,252
Outstanding Balance
$141,314
Interest Rate
3.73%
Mortgage Type
New Conventional
Estimated Equity
$350,675
Purchase Details
Closed on
Jun 27, 2009
Sold by
H & A Investment Co Llc
Bought by
Gluch Daniel S and Gluch Stephanie Joy
Home Financials for this Owner
Home Financials are based on the most recent Mortgage that was taken out on this home.
Original Mortgage
$282,908
Interest Rate
4.87%
Mortgage Type
Unknown
Create a Home Valuation Report for This Property
The Home Valuation Report is an in-depth analysis detailing your home's value as well as a comparison with similar homes in the area
Home Values in the Area
Average Home Value in this Area
Purchase History
| Date | Buyer | Sale Price | Title Company |
|---|---|---|---|
| Feng Wenhui | $202,000 | North American Title Co Inc | |
| Gluch Daniel S | $152,500 | Old Republic Title Company |
Source: Public Records
Mortgage History
| Date | Status | Borrower | Loan Amount |
|---|---|---|---|
| Open | Feng Wenhui | $161,252 | |
| Previous Owner | Gluch Daniel S | $282,908 | |
| Previous Owner | Gluch Daniel S | $121,623 |
Source: Public Records
Tax History Compared to Growth
Tax History
| Year | Tax Paid | Tax Assessment Tax Assessment Total Assessment is a certain percentage of the fair market value that is determined by local assessors to be the total taxable value of land and additions on the property. | Land | Improvement |
|---|---|---|---|---|
| 2025 | $3,321 | $220,437 | $110,219 | $110,218 |
| 2024 | $3,321 | $216,115 | $108,058 | $108,057 |
| 2023 | $3,261 | $211,879 | $105,940 | $105,939 |
| 2022 | $3,183 | $207,725 | $103,863 | $103,862 |
| 2021 | $3,122 | $203,653 | $101,827 | $101,826 |
| 2020 | $3,156 | $201,565 | $100,783 | $100,782 |
| 2019 | $2,710 | $175,565 | $109,663 | $65,902 |
| 2018 | $2,619 | $172,123 | $107,513 | $64,610 |
| 2017 | $2,288 | $168,749 | $105,405 | $63,344 |
| 2016 | $2,220 | $165,441 | $103,339 | $62,102 |
| 2015 | $2,190 | $162,957 | $101,787 | $61,170 |
| 2014 | $2,132 | $159,766 | $99,794 | $59,972 |
Source: Public Records
Map
Nearby Homes
- 3452 18th St Unit A
- 150 San Carlos St Unit A
- 150 San Carlos St Unit 150
- 48 Sycamore St
- 81 Lapidge St
- 3310 19th St Unit 303
- 88 Hoff St Unit 108
- 88 Hoff St Unit 101
- 3214 17th St
- 3470 20th St Unit 2
- 550 S Van Ness Ave Unit 207
- 3545 20th St
- 31 Camp St Unit A
- 503 Capp St
- 108 Albion St Unit B
- 173 Julian Ave
- 20-24 Cumberland St
- 2360 Folsom St Unit A
- 569 Capp St Unit 571
- 473 S Van Ness Ave
- 2208 Mission St
- 2208 Mission St
- 2208 Mission St Unit 507
- 2208 Mission St Unit 506
- 2208 Mission St Unit 505
- 2208 Mission St Unit 504
- 2208 Mission St Unit 503
- 2208 Mission St Unit 502
- 2208 Mission St Unit 501
- 2208 Mission St Unit 407
- 2208 Mission St Unit 406
- 2208 Mission St Unit 405
- 2208 Mission St Unit 404
- 2208 Mission St Unit 403
- 2208 Mission St Unit 402
- 2208 Mission St Unit 401
- 2208 Mission St Unit 307
- 2208 Mission St Unit 306
- 2208 Mission St Unit 305
- 2208 Mission St Unit 303