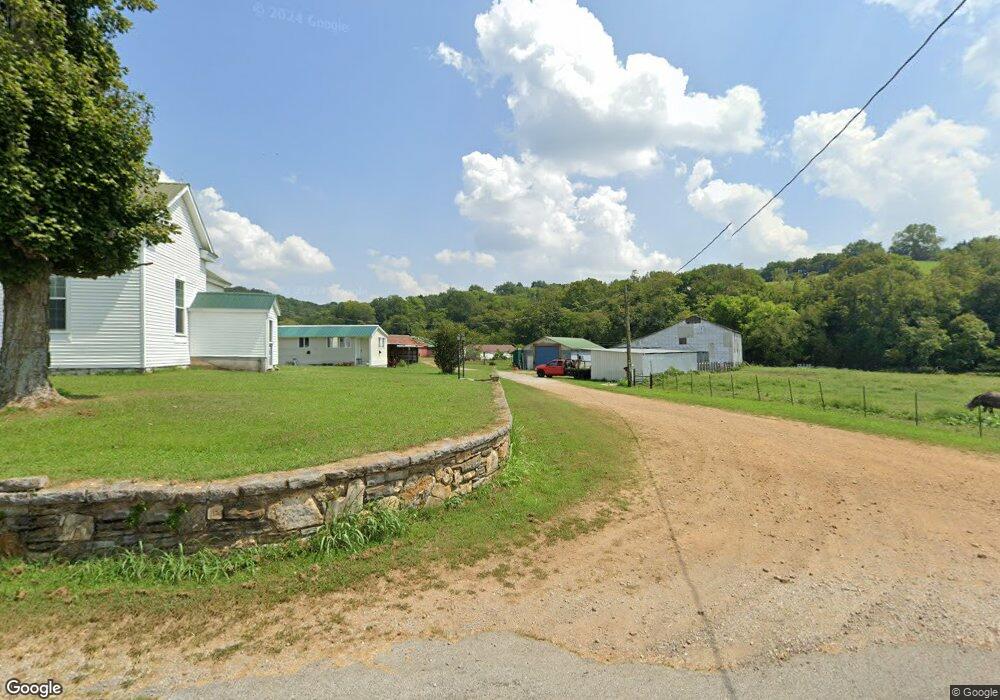
2208 Mooresville Rd Lynnville, TN 38472
Estimated Value: $327,000 - $786,000
--
Bed
1
Bath
2,101
Sq Ft
$267/Sq Ft
Est. Value
About This Home
This home is located at 2208 Mooresville Rd, Lynnville, TN 38472 and is currently estimated at $560,323, approximately $266 per square foot. 2208 Mooresville Rd is a home located in Marshall County with nearby schools including Cornersville Elementary School and Cornersville School.
Ownership History
Date
Name
Owned For
Owner Type
Purchase Details
Closed on
Apr 26, 2021
Sold by
Helton Michael and Helton Vicki
Bought by
Helton Joshua Owen and Helton Alicia J
Current Estimated Value
Home Financials for this Owner
Home Financials are based on the most recent Mortgage that was taken out on this home.
Original Mortgage
$229,826
Outstanding Balance
$207,954
Interest Rate
3%
Mortgage Type
Commercial
Estimated Equity
$352,369
Purchase Details
Closed on
Nov 10, 2018
Sold by
Helton Joshua Owen
Bought by
Sanders William Larry and Sanders Linda Carol
Purchase Details
Closed on
May 20, 2016
Sold by
Helton Michael
Bought by
Helton Joshua Owen and Helton Alicia J
Home Financials for this Owner
Home Financials are based on the most recent Mortgage that was taken out on this home.
Original Mortgage
$141,217
Interest Rate
3.59%
Mortgage Type
New Conventional
Purchase Details
Closed on
Apr 22, 2002
Bought by
Helton Phillip A
Create a Home Valuation Report for This Property
The Home Valuation Report is an in-depth analysis detailing your home's value as well as a comparison with similar homes in the area
Home Values in the Area
Average Home Value in this Area
Purchase History
| Date | Buyer | Sale Price | Title Company |
|---|---|---|---|
| Helton Joshua Owen | -- | None Available | |
| Sanders William Larry | -- | -- | |
| Helton Joshua Owen | $100,000 | -- | |
| Helton Phillip A | -- | -- |
Source: Public Records
Mortgage History
| Date | Status | Borrower | Loan Amount |
|---|---|---|---|
| Open | Helton Joshua Owen | $229,826 | |
| Previous Owner | Helton Joshua Owen | $141,217 |
Source: Public Records
Tax History Compared to Growth
Tax History
| Year | Tax Paid | Tax Assessment Tax Assessment Total Assessment is a certain percentage of the fair market value that is determined by local assessors to be the total taxable value of land and additions on the property. | Land | Improvement |
|---|---|---|---|---|
| 2024 | $1,118 | $61,450 | $27,275 | $34,175 |
| 2023 | $1,228 | $61,450 | $27,275 | $34,175 |
| 2022 | $1,118 | $61,450 | $27,275 | $34,175 |
| 2021 | $1,228 | $43,675 | $19,700 | $23,975 |
| 2020 | $1,228 | $43,675 | $19,700 | $23,975 |
| 2019 | $1,154 | $41,050 | $19,700 | $21,350 |
| 2018 | $1,143 | $41,375 | $20,025 | $21,350 |
| 2017 | $1,143 | $41,375 | $20,025 | $21,350 |
| 2016 | $1,111 | $34,500 | $15,650 | $18,850 |
| 2015 | $1,111 | $34,500 | $15,650 | $18,850 |
| 2014 | $1,111 | $34,500 | $15,650 | $18,850 |
Source: Public Records
Map
Nearby Homes
- 2031 Simmons Ridge Rd
- 0 Simmons Ridge Rd
- 2533 Otis Fowler Rd
- 1520 Simmons Ridge Rd
- 2264 Collier Rd
- 2250 Collier Rd
- 2121 Lynnville Hwy
- 2150 Poarch Hollow Rd
- 2846 Fuller Hollow Rd
- 4923 Blue Creek Rd
- 2733 Mcconnell Rd
- 104 Terry Ln
- 203 Terry Ln
- 0 Collier Rd Unit RTC2918199
- 105 Fairview Ave
- 109 Fairview Ave
- 113 Fairview Ave
- 139 Fairview Ave
- 114 Elm St
- 207 W Hill St
- 2211 Mooresville Rd
- 2268 Simmons Ridge Rd
- 2140 Mooresville Rd
- 2101 Mooresville Rd
- 2180 Coyle Rd
- 2330 Mooresville Rd
- 2250 Mooresville Rd
- 2080 Mooresville Rd
- 2200 Coyle Rd
- 2077 Mooresville Rd
- 2155 Coyle Rd
- 2255 Coyle Rd
- 2121 Coyle Rd
- 2193 Simmons Ridge Rd
- 2181 Simmons Ridge Rd
- 2333 Mooresville Rd
- 2205 Simmons Ridge Rd
- 2455 Wright Rd
- 2055 Mooresville Rd
- 2700 Lynnville Hwy