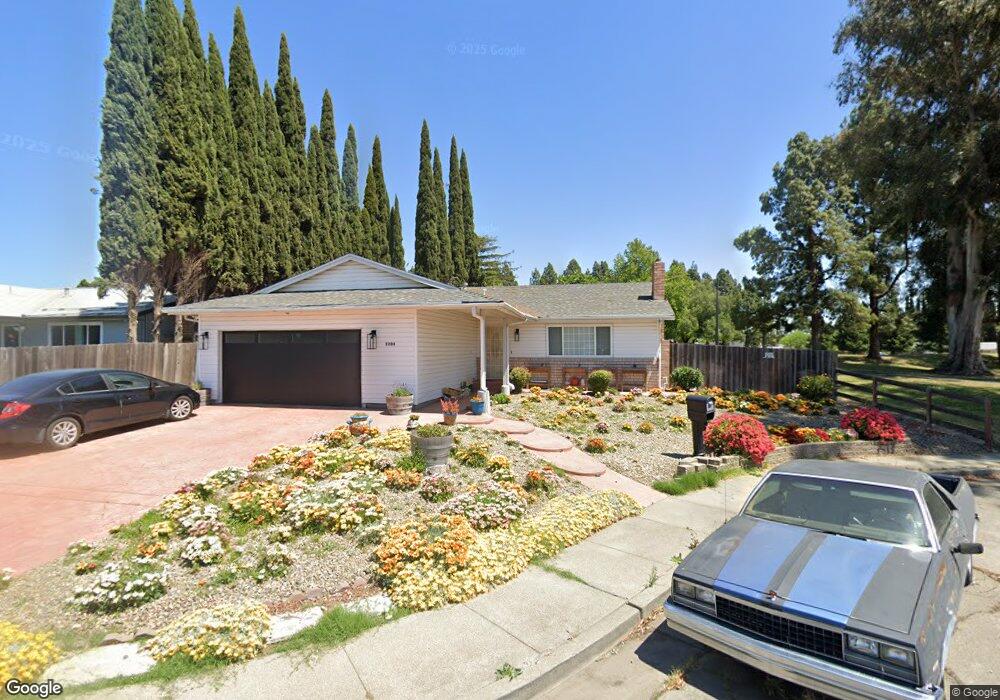
2208 Older Place Fairfield, CA 94533
Estimated Value: $511,000 - $537,000
4
Beds
2
Baths
1,608
Sq Ft
$326/Sq Ft
Est. Value
About This Home
This home is located at 2208 Older Place, Fairfield, CA 94533 and is currently estimated at $524,810, approximately $326 per square foot. 2208 Older Place is a home located in Solano County with nearby schools including Tolenas Academy of Music & Media, Grange Middle School, and Fairfield High School.
Ownership History
Date
Name
Owned For
Owner Type
Purchase Details
Closed on
Dec 22, 2022
Sold by
Austin Stanley James Andrew
Bought by
Mann Jennifer Marie and Stanley James Andrew
Current Estimated Value
Purchase Details
Closed on
Aug 9, 2016
Sold by
Martin Jeffrey Phillip and Martin Sylvia Delores
Bought by
Stanley James Andrew Austin
Home Financials for this Owner
Home Financials are based on the most recent Mortgage that was taken out on this home.
Original Mortgage
$334,030
Interest Rate
3.41%
Mortgage Type
VA
Purchase Details
Closed on
Oct 9, 2015
Sold by
Martin Jeffery P
Bought by
Martin Jeffery Phillip and Delor Sylvia
Purchase Details
Closed on
Jun 14, 2006
Sold by
Martin Anne B
Bought by
Martin Jeffrey P
Home Financials for this Owner
Home Financials are based on the most recent Mortgage that was taken out on this home.
Original Mortgage
$361,250
Interest Rate
7.05%
Mortgage Type
Purchase Money Mortgage
Create a Home Valuation Report for This Property
The Home Valuation Report is an in-depth analysis detailing your home's value as well as a comparison with similar homes in the area
Home Values in the Area
Average Home Value in this Area
Purchase History
| Date | Buyer | Sale Price | Title Company |
|---|---|---|---|
| Mann Jennifer Marie | -- | -- | |
| Stanley James Andrew Austin | $327,000 | Old Republic Title Company | |
| Martin Jeffery Phillip | -- | None Available | |
| Martin Jeffrey P | -- | Alliance Title Company |
Source: Public Records
Mortgage History
| Date | Status | Borrower | Loan Amount |
|---|---|---|---|
| Previous Owner | Stanley James Andrew Austin | $334,030 | |
| Previous Owner | Martin Jeffrey P | $361,250 |
Source: Public Records
Tax History Compared to Growth
Tax History
| Year | Tax Paid | Tax Assessment Tax Assessment Total Assessment is a certain percentage of the fair market value that is determined by local assessors to be the total taxable value of land and additions on the property. | Land | Improvement |
|---|---|---|---|---|
| 2025 | $5,027 | $449,850 | $118,647 | $331,203 |
| 2024 | $5,027 | $441,030 | $116,321 | $324,709 |
| 2023 | $4,115 | $364,771 | $78,085 | $286,686 |
| 2022 | $4,066 | $357,619 | $76,554 | $281,065 |
| 2021 | $4,026 | $350,607 | $75,053 | $275,554 |
| 2020 | $3,931 | $347,013 | $74,284 | $272,729 |
| 2019 | $3,835 | $340,210 | $72,828 | $267,382 |
| 2018 | $3,958 | $333,540 | $71,400 | $262,140 |
| 2017 | $3,775 | $327,000 | $70,000 | $257,000 |
| 2016 | $1,480 | $125,608 | $33,759 | $91,849 |
| 2015 | $1,383 | $123,722 | $33,252 | $90,470 |
| 2014 | $20 | $121,299 | $32,601 | $88,698 |
Source: Public Records
Map
Nearby Homes
- 2049 Harte Ct
- 2056 Davis Dr
- 2120 Merritt Place
- 2350 Gull Ct
- 126 Chevy Chase Ct
- 1461 Festival Ln
- 1571 Luminate Ln
- 66 Villa Cir
- 120 Century Ct
- 1461 Monument Ln
- 1460 Monument Ln
- 1575 Feast Ct
- 1465 Monument Ln
- 1465 Festival Ln
- 1571 Feast Ct
- 1473 Monument Ln
- 1477 Festival Ln
- 1477 Monument Ln
- 1481 Monument Ln
- 102 Royal Oak Ct Unit 102
- 2216 Older Place
- 2224 Older Place
- 2217 Ross Place
- 2231 Older Place
- 2232 Older Place
- 2223 Older Place
- 2225 Ross Place
- 2215 Older Place
- 2157 Harte Ct
- 2247 Older Place
- 2244 Older Place
- 2253 Older Place
- 2145 Harte Ct
- 2233 Ross Place
- 2240 Emerson Place
- 2248 Emerson Place
- 2158 Wylie Place
- 2232 Emerson Place
- 2256 Emerson Place