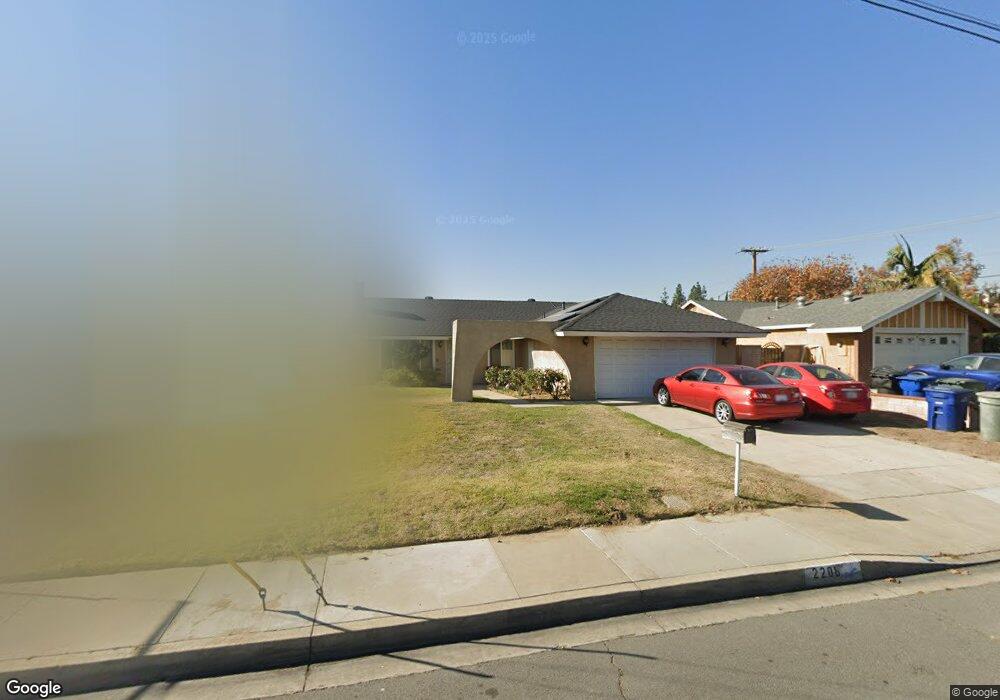
2208 S Bon View Ave Ontario, CA 91761
Downtown Ontario NeighborhoodEstimated Value: $583,000 - $687,000
3
Beds
2
Baths
1,118
Sq Ft
$582/Sq Ft
Est. Value
About This Home
This home is located at 2208 S Bon View Ave, Ontario, CA 91761 and is currently estimated at $650,493, approximately $581 per square foot. 2208 S Bon View Ave is a home located in San Bernardino County with nearby schools including Bon View Elementary, De Anza Middle, and Ontario High School.
Ownership History
Date
Name
Owned For
Owner Type
Purchase Details
Closed on
Jun 25, 2008
Sold by
Garcia Denis Yunuem
Bought by
Garcia Gary J
Current Estimated Value
Home Financials for this Owner
Home Financials are based on the most recent Mortgage that was taken out on this home.
Original Mortgage
$200,000
Outstanding Balance
$128,567
Interest Rate
6%
Mortgage Type
New Conventional
Estimated Equity
$521,926
Purchase Details
Closed on
Aug 29, 2006
Sold by
Garcia Gary J
Bought by
Garcia Gary J and Garcia Denis Yunuem
Home Financials for this Owner
Home Financials are based on the most recent Mortgage that was taken out on this home.
Original Mortgage
$183,000
Interest Rate
6.99%
Mortgage Type
Balloon
Purchase Details
Closed on
Apr 6, 2001
Sold by
Galdamez Jose and Galdamez Guadalupe
Bought by
Garcia Gary J
Home Financials for this Owner
Home Financials are based on the most recent Mortgage that was taken out on this home.
Original Mortgage
$152,605
Interest Rate
7.14%
Mortgage Type
FHA
Purchase Details
Closed on
Oct 25, 1995
Sold by
Sehorn Clifford D and Sehorn Kay M
Bought by
Galdamez Jose and Galdamez Guadalupe
Home Financials for this Owner
Home Financials are based on the most recent Mortgage that was taken out on this home.
Original Mortgage
$113,050
Interest Rate
7.58%
Purchase Details
Closed on
Dec 6, 1994
Sold by
Sehorn Clifford D and Sehorn Kay M
Bought by
Sehorn Clifford D and Sehorn Kay M
Purchase Details
Closed on
May 6, 1994
Sold by
U S Bancorp Mtg Company
Bought by
Sehorn Clifford D and Sehorn Kay M
Home Financials for this Owner
Home Financials are based on the most recent Mortgage that was taken out on this home.
Original Mortgage
$90,300
Interest Rate
5.55%
Purchase Details
Closed on
Oct 20, 1993
Sold by
Lender Service Bureau
Bought by
U S Bancorp Mtg Company
Create a Home Valuation Report for This Property
The Home Valuation Report is an in-depth analysis detailing your home's value as well as a comparison with similar homes in the area
Home Values in the Area
Average Home Value in this Area
Purchase History
| Date | Buyer | Sale Price | Title Company |
|---|---|---|---|
| Garcia Gary J | -- | Fnt | |
| Garcia Gary J | -- | Accommodation | |
| Garcia Gary J | -- | Fidelity National Title | |
| Garcia Gary J | $155,000 | Fidelity National Title Ins | |
| Galdamez Jose | $119,000 | First American Title Ins Co | |
| Sehorn Clifford D | -- | -- | |
| Sehorn Clifford D | $113,000 | Stewart Title Company | |
| U S Bancorp Mtg Company | $130,000 | Stewart Title |
Source: Public Records
Mortgage History
| Date | Status | Borrower | Loan Amount |
|---|---|---|---|
| Open | Garcia Gary J | $200,000 | |
| Closed | Garcia Gary J | $183,000 | |
| Previous Owner | Garcia Gary J | $152,605 | |
| Previous Owner | Galdamez Jose | $113,050 | |
| Previous Owner | Sehorn Clifford D | $90,300 | |
| Closed | Garcia Gary J | $4,650 |
Source: Public Records
Tax History Compared to Growth
Tax History
| Year | Tax Paid | Tax Assessment Tax Assessment Total Assessment is a certain percentage of the fair market value that is determined by local assessors to be the total taxable value of land and additions on the property. | Land | Improvement |
|---|---|---|---|---|
| 2025 | $2,570 | $233,563 | $81,747 | $151,816 |
| 2024 | $2,570 | $228,983 | $80,144 | $148,839 |
| 2023 | $2,499 | $224,494 | $78,573 | $145,921 |
| 2022 | $2,467 | $220,092 | $77,032 | $143,060 |
| 2021 | $2,452 | $215,777 | $75,522 | $140,255 |
| 2020 | $2,410 | $213,565 | $74,748 | $138,817 |
| 2019 | $2,390 | $209,377 | $73,282 | $136,095 |
| 2018 | $2,358 | $205,271 | $71,845 | $133,426 |
| 2017 | $2,275 | $201,246 | $70,436 | $130,810 |
| 2016 | $2,188 | $197,300 | $69,055 | $128,245 |
| 2015 | $2,174 | $194,337 | $68,018 | $126,319 |
| 2014 | $2,108 | $190,531 | $66,686 | $123,845 |
Source: Public Records
Map
Nearby Homes
- 4235 S Gasly Paseo
- 0 Vineyard Unit CV25067044
- 4245 S Grasly Paseo
- 4233 S Grasly Paseo
- 0 Phillips Unit CV23180894
- 2119 S Phoenix Place
- 2408 S Taylor Place
- 2030 S Bon View Ave Unit G
- 840 E Cedar St
- 2437 S Garfield Place
- 2001 S Campus Ave Unit 7F
- 2453 S Marigold Place
- 2300 S Sultana Ave Unit 298
- 513 E Fairfield Ct
- 2148 S Sultana Ave
- 310 E Philadelphia St Unit 35
- 310 E Philadelphia St
- 1020 E Tam o Shanter Ct
- 304 E Cedar St
- 2708 S Parkside Dr
- 2214 S Bon View Ave
- 2202 S Bon View Ave
- 2209 S Hope Place
- 2203 S Hope Place
- 2220 S Bon View Ave
- 901 E Sanderling St
- 2221 S Hope Place
- 2221 S Bon View Ave
- 907 E Sanderling St
- 2227 S Bon View Ave
- 2208 S Hope Place
- 2202 S Hope Place
- 2214 S Hope Place
- 856 E Wisteria Ct
- 850 E Wisteria Ct
- 2233 S Bon View Ave
- 2220 S Goldcrest Ave
- 844 E Wisteria Ct
- 913 E Sanderling St
- 844 E Monticello St