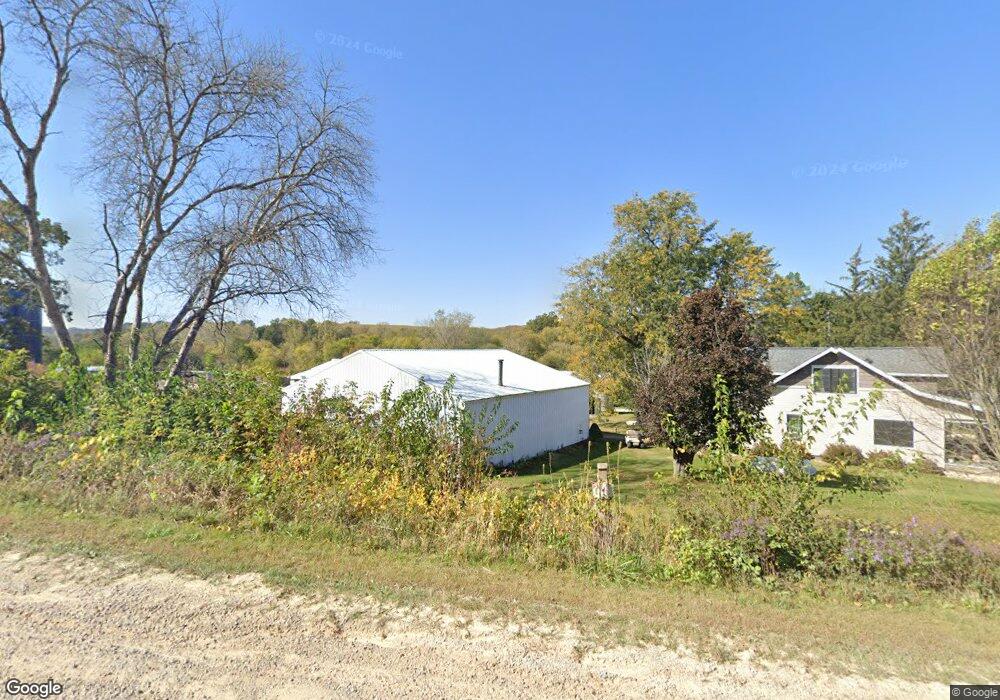
22087 Cannon Rd Elkader, IA 52043
Estimated Value: $181,000 - $265,278
2
Beds
2
Baths
1,474
Sq Ft
$146/Sq Ft
Est. Value
About This Home
This home is located at 22087 Cannon Rd, Elkader, IA 52043 and is currently estimated at $215,320, approximately $146 per square foot. 22087 Cannon Rd is a home located in Clayton County with nearby schools including Central Elementary School and Central Middle School/High School.
Ownership History
Date
Name
Owned For
Owner Type
Purchase Details
Closed on
Feb 2, 2009
Sold by
Knight Nolan J and Knight Marie J
Bought by
Heritage Museum Of The Knights Inc
Current Estimated Value
Purchase Details
Closed on
Aug 14, 2007
Sold by
Ton Brimeyer Farms Llc
Bought by
Wingert Wayne J and Wingert Jamie J
Purchase Details
Closed on
Apr 17, 2006
Sold by
Schroeder Aaron M and Schroeder Shanna L
Bought by
Wingert Wayne J and Wingert Jamie J
Purchase Details
Closed on
Apr 10, 2006
Sold by
Helbing Russell H and Helbing Linda M
Bought by
Schroeder Aaron and Schroeder Shanna
Create a Home Valuation Report for This Property
The Home Valuation Report is an in-depth analysis detailing your home's value as well as a comparison with similar homes in the area
Home Values in the Area
Average Home Value in this Area
Purchase History
| Date | Buyer | Sale Price | Title Company |
|---|---|---|---|
| Heritage Museum Of The Knights Inc | $3,500 | None Available | |
| Wingert Wayne J | $7,000 | None Available | |
| Wingert Wayne J | $104,000 | None Available | |
| Schroeder Aaron | $67,000 | None Available |
Source: Public Records
Tax History Compared to Growth
Tax History
| Year | Tax Paid | Tax Assessment Tax Assessment Total Assessment is a certain percentage of the fair market value that is determined by local assessors to be the total taxable value of land and additions on the property. | Land | Improvement |
|---|---|---|---|---|
| 2025 | $1,388 | $136,439 | $16,098 | $120,341 |
| 2024 | $1,342 | $112,585 | $13,407 | $99,178 |
| 2023 | $1,250 | $112,585 | $13,407 | $99,178 |
| 2022 | $1,196 | $88,685 | $10,664 | $78,021 |
| 2021 | $1,162 | $89,816 | $11,795 | $78,021 |
| 2020 | $1,162 | $85,050 | $11,694 | $73,356 |
| 2019 | $2,016 | $157,313 | $59,950 | $97,363 |
| 2018 | $2,016 | $151,292 | $59,950 | $91,342 |
| 2017 | $1,984 | $151,292 | $59,950 | $91,342 |
| 2015 | $1,380 | $122,616 | $58,950 | $63,666 |
| 2014 | $1,366 | $107,354 | $38,970 | $68,384 |
Source: Public Records
Map
Nearby Homes