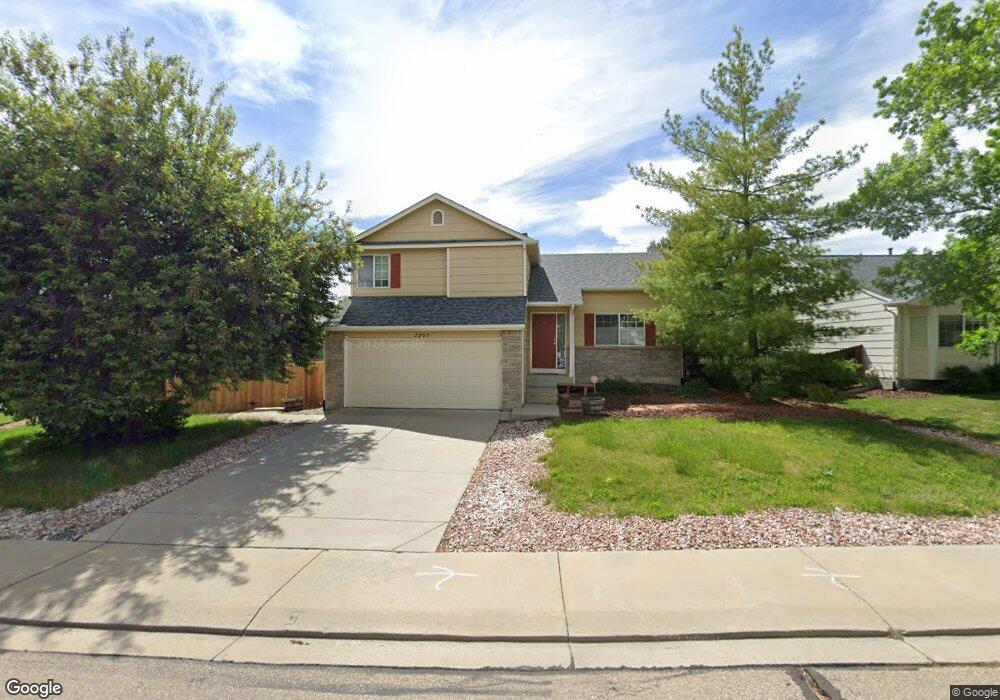
2209 Billings Ln Longmont, CO 80504
East Side NeighborhoodEstimated Value: $530,475 - $595,000
3
Beds
3
Baths
2,427
Sq Ft
$234/Sq Ft
Est. Value
About This Home
This home is located at 2209 Billings Ln, Longmont, CO 80504 and is currently estimated at $568,369, approximately $234 per square foot. 2209 Billings Ln is a home located in Boulder County with nearby schools including Alpine Elementary School, Skyline High School, and Longmont Christian School.
Ownership History
Date
Name
Owned For
Owner Type
Purchase Details
Closed on
Apr 16, 2014
Sold by
Wong Edmund and Tan Wan Hwa
Bought by
Hattig Kristi L
Current Estimated Value
Home Financials for this Owner
Home Financials are based on the most recent Mortgage that was taken out on this home.
Original Mortgage
$202,000
Outstanding Balance
$153,558
Interest Rate
4.34%
Mortgage Type
New Conventional
Estimated Equity
$414,811
Purchase Details
Closed on
Mar 2, 2013
Sold by
Wong Edmund
Bought by
Wong Edmund
Purchase Details
Closed on
Mar 2, 2012
Sold by
Wong Emdund
Bought by
Wong Edmund
Purchase Details
Closed on
Feb 28, 2002
Sold by
Melody Homes Inc
Bought by
Wong Edmund
Home Financials for this Owner
Home Financials are based on the most recent Mortgage that was taken out on this home.
Original Mortgage
$209,851
Interest Rate
6.81%
Mortgage Type
FHA
Create a Home Valuation Report for This Property
The Home Valuation Report is an in-depth analysis detailing your home's value as well as a comparison with similar homes in the area
Home Values in the Area
Average Home Value in this Area
Purchase History
| Date | Buyer | Sale Price | Title Company |
|---|---|---|---|
| Hattig Kristi L | $252,500 | Land Title Guarantee Company | |
| Wong Edmund | -- | Fitco | |
| Wong Edmund | -- | Fitco | |
| Wong Edmund | $213,184 | Land Title Guarantee Company |
Source: Public Records
Mortgage History
| Date | Status | Borrower | Loan Amount |
|---|---|---|---|
| Open | Hattig Kristi L | $202,000 | |
| Previous Owner | Wong Edmund | $209,851 |
Source: Public Records
Tax History Compared to Growth
Tax History
| Year | Tax Paid | Tax Assessment Tax Assessment Total Assessment is a certain percentage of the fair market value that is determined by local assessors to be the total taxable value of land and additions on the property. | Land | Improvement |
|---|---|---|---|---|
| 2025 | $3,121 | $34,106 | $7,900 | $26,206 |
| 2024 | $3,121 | $34,106 | $7,900 | $26,206 |
| 2023 | $3,079 | $32,629 | $8,744 | $27,571 |
| 2022 | $2,747 | $27,758 | $6,637 | $21,121 |
| 2021 | $2,782 | $28,557 | $6,828 | $21,729 |
| 2020 | $2,493 | $25,662 | $6,221 | $19,441 |
| 2019 | $2,454 | $25,662 | $6,221 | $19,441 |
| 2018 | $2,205 | $23,213 | $6,264 | $16,949 |
| 2017 | $2,175 | $25,663 | $6,925 | $18,738 |
| 2016 | $2,007 | $20,998 | $7,880 | $13,118 |
| 2015 | $1,913 | $17,250 | $4,060 | $13,190 |
| 2014 | $1,611 | $17,250 | $4,060 | $13,190 |
Source: Public Records
Map
Nearby Homes
- 2144 Santa fe Dr
- 650 Olympia Ave
- 1012 Sonoma Cir Unit 5B
- 2410 Santa fe Dr Unit A
- 635 Coronado Place
- 2100 Boise Ct
- 2225 Calais Dr
- 2225 Calais Dr Unit 9
- 2481 Santa fe Dr Unit A
- 1484 Coral Place
- 1458 Coral Place
- 2127 Astoria Ln
- 2307 Calais Dr Unit 13A
- 2010 Glenarbor Ct
- 2321 Calais Dr Unit 15G
- 2324 Calais Dr Unit A
- 2217 Medford St
- 2417 Calais Dr Unit G
- 2435 Calais Dr Unit I
- 2435 Calais Dr Unit H
- 2215 Billings Ln
- 2203 Billings Ln
- 2236 Santa fe Dr
- 2221 Billings Ln
- 2240 Santa fe Dr
- 2216 Billings Ln
- 2210 Billings Ln
- 2101 Santa fe Dr
- 2212 Santa fe Dr
- 2244 Santa fe Dr
- 2229 Santa fe Dr
- 2225 Santa fe Dr
- 2233 Santa fe Dr
- 2221 Santa fe Dr
- 2111 Santa fe Dr
- 2237 Santa fe Dr
- 2217 Santa fe Dr
- 2200 Santa fe Dr
- 2131 Santa fe Dr
- 2248 Santa fe Dr