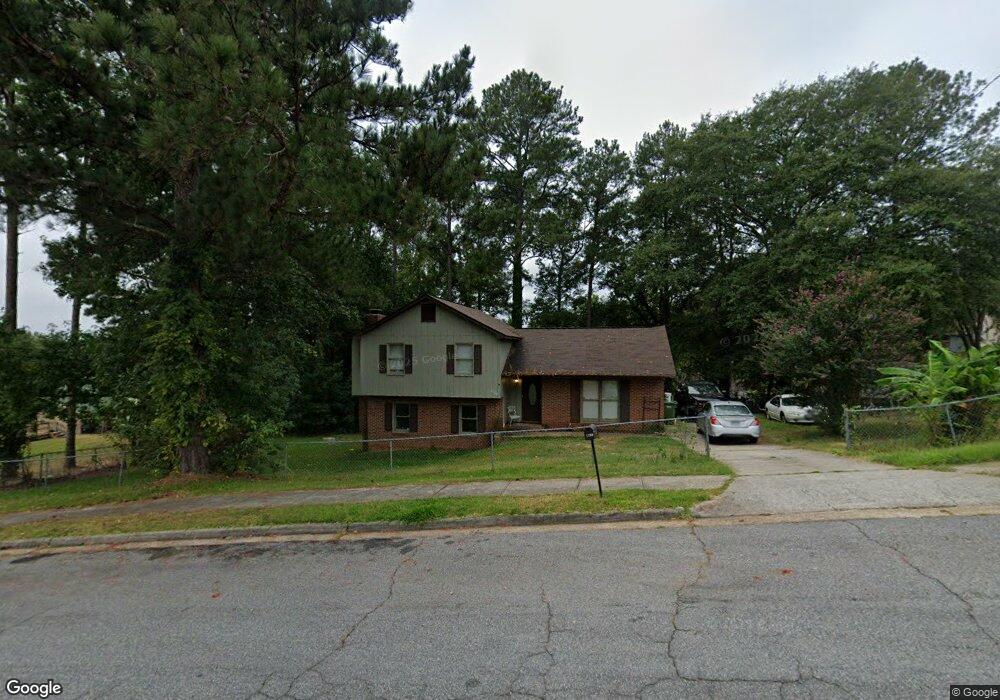
2209 Monaco Dr Columbus, GA 31903
Southern Columbus NeighborhoodEstimated Value: $117,000 - $165,000
4
Beds
3
Baths
1,752
Sq Ft
$81/Sq Ft
Est. Value
About This Home
This home is located at 2209 Monaco Dr, Columbus, GA 31903 and is currently estimated at $141,391, approximately $80 per square foot. 2209 Monaco Dr is a home located in Muscogee County with nearby schools including Glenallen Elementary School, Dorothy Height Elementary School, and Eddy Middle School.
Ownership History
Date
Name
Owned For
Owner Type
Purchase Details
Closed on
Dec 18, 2009
Sold by
Table Willie J
Bought by
Harrison Cheryl Shante Walton
Current Estimated Value
Home Financials for this Owner
Home Financials are based on the most recent Mortgage that was taken out on this home.
Original Mortgage
$102,150
Outstanding Balance
$66,113
Interest Rate
4.75%
Mortgage Type
VA
Estimated Equity
$75,278
Purchase Details
Closed on
Jul 7, 2009
Sold by
King Sylvester
Bought by
Wells Fargo Bank Na
Purchase Details
Closed on
Feb 16, 2007
Sold by
Copar Investments Inc
Bought by
Table Willie J
Home Financials for this Owner
Home Financials are based on the most recent Mortgage that was taken out on this home.
Original Mortgage
$24,980
Interest Rate
5.89%
Mortgage Type
Stand Alone Second
Create a Home Valuation Report for This Property
The Home Valuation Report is an in-depth analysis detailing your home's value as well as a comparison with similar homes in the area
Home Values in the Area
Average Home Value in this Area
Purchase History
| Date | Buyer | Sale Price | Title Company |
|---|---|---|---|
| Harrison Cheryl Shante Walton | $100,000 | None Available | |
| Wells Fargo Bank Na | $52,249 | None Available | |
| Table Willie J | $124,900 | None Available |
Source: Public Records
Mortgage History
| Date | Status | Borrower | Loan Amount |
|---|---|---|---|
| Open | Harrison Cheryl Shante Walton | $102,150 | |
| Previous Owner | Table Willie J | $24,980 | |
| Previous Owner | Table Willie J | $99,920 |
Source: Public Records
Tax History Compared to Growth
Tax History
| Year | Tax Paid | Tax Assessment Tax Assessment Total Assessment is a certain percentage of the fair market value that is determined by local assessors to be the total taxable value of land and additions on the property. | Land | Improvement |
|---|---|---|---|---|
| 2025 | $1,424 | $40,784 | $4,704 | $36,080 |
| 2024 | $1,423 | $41,308 | $3,476 | $37,832 |
| 2023 | $738 | $41,308 | $3,476 | $37,832 |
| 2022 | $1,484 | $33,852 | $3,476 | $30,376 |
| 2021 | $1,477 | $33,048 | $3,476 | $29,572 |
| 2020 | $1,478 | $33,048 | $3,476 | $29,572 |
| 2019 | $1,484 | $33,048 | $3,476 | $29,572 |
| 2018 | $1,484 | $33,048 | $3,476 | $29,572 |
| 2017 | $1,491 | $33,048 | $3,476 | $29,572 |
| 2016 | $1,497 | $49,569 | $4,474 | $45,095 |
| 2015 | $1,500 | $49,569 | $4,474 | $45,095 |
| 2014 | $1,502 | $49,569 | $4,474 | $45,095 |
| 2013 | -- | $49,569 | $4,474 | $45,095 |
Source: Public Records
Map
Nearby Homes