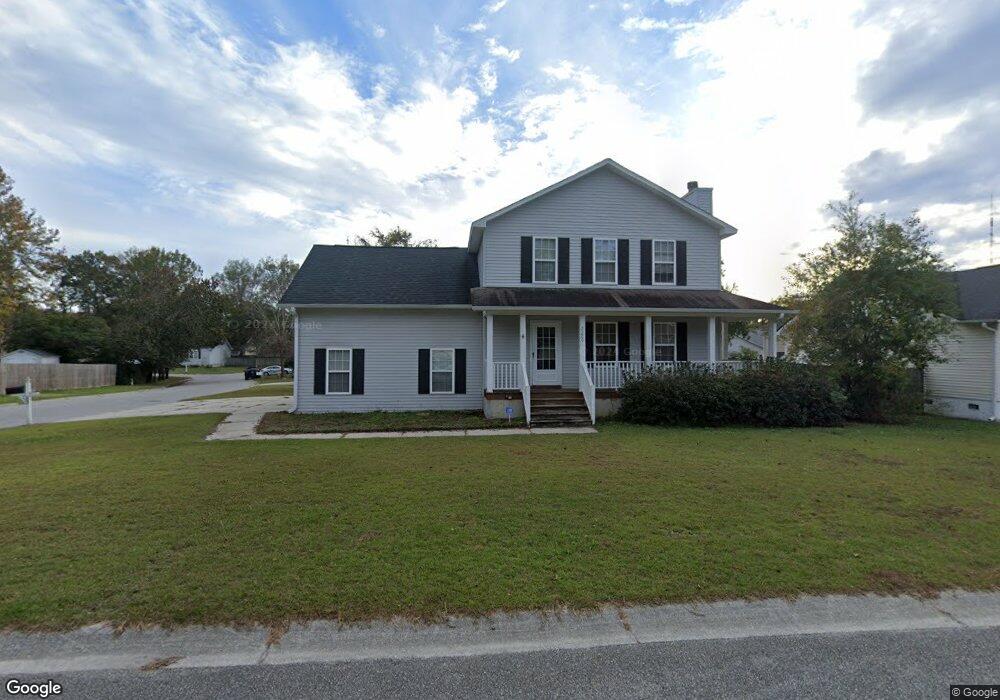
2209 Sawmill Trace Ln North Charleston, SC 29420
Estimated Value: $308,000 - $355,000
3
Beds
3
Baths
1,935
Sq Ft
$173/Sq Ft
Est. Value
About This Home
This home is located at 2209 Sawmill Trace Ln, North Charleston, SC 29420 and is currently estimated at $334,348, approximately $172 per square foot. 2209 Sawmill Trace Ln is a home located in Dorchester County with nearby schools including Windsor Hill Arts Infused Elementary School, River Oaks Middle School, and Fort Dorchester High School.
Ownership History
Date
Name
Owned For
Owner Type
Purchase Details
Closed on
Jun 7, 2012
Sold by
Secretary Of Veterans Affairs
Bought by
Brown Ronnie T
Current Estimated Value
Home Financials for this Owner
Home Financials are based on the most recent Mortgage that was taken out on this home.
Original Mortgage
$115,862
Outstanding Balance
$82,409
Interest Rate
4.4%
Mortgage Type
FHA
Estimated Equity
$251,939
Purchase Details
Closed on
Oct 21, 2005
Sold by
Beaudry Michael L and Beaudry Elizabeth A
Bought by
Moul Brandon M and Moul Melissa J
Home Financials for this Owner
Home Financials are based on the most recent Mortgage that was taken out on this home.
Original Mortgage
$173,100
Interest Rate
5%
Mortgage Type
Adjustable Rate Mortgage/ARM
Purchase Details
Closed on
Jan 10, 2003
Sold by
Le Bao Van T and Le Nu N
Bought by
Beaudry Michael L and Beaudry Elizabeth A
Create a Home Valuation Report for This Property
The Home Valuation Report is an in-depth analysis detailing your home's value as well as a comparison with similar homes in the area
Home Values in the Area
Average Home Value in this Area
Purchase History
| Date | Buyer | Sale Price | Title Company |
|---|---|---|---|
| Brown Ronnie T | $118,000 | -- | |
| Moul Brandon M | $169,500 | -- | |
| Beaudry Michael L | $149,900 | -- |
Source: Public Records
Mortgage History
| Date | Status | Borrower | Loan Amount |
|---|---|---|---|
| Open | Brown Ronnie T | $115,862 | |
| Previous Owner | Moul Brandon M | $173,100 |
Source: Public Records
Tax History Compared to Growth
Tax History
| Year | Tax Paid | Tax Assessment Tax Assessment Total Assessment is a certain percentage of the fair market value that is determined by local assessors to be the total taxable value of land and additions on the property. | Land | Improvement |
|---|---|---|---|---|
| 2024 | $1,571 | $12,902 | $3,400 | $9,502 |
| 2023 | $1,571 | $9,927 | $1,800 | $8,127 |
| 2022 | $1,402 | $7,480 | $1,690 | $5,790 |
| 2021 | $1,402 | $7,480 | $1,690 | $5,790 |
| 2020 | $1,309 | $6,500 | $1,470 | $5,030 |
| 2019 | $1,268 | $6,500 | $1,470 | $5,030 |
| 2018 | $1,118 | $6,500 | $1,470 | $5,030 |
| 2017 | $1,110 | $6,500 | $1,470 | $5,030 |
| 2016 | $1,097 | $6,500 | $1,470 | $5,030 |
| 2015 | $1,093 | $6,500 | $1,470 | $5,030 |
| 2014 | $940 | $141,400 | $0 | $0 |
| 2013 | -- | $5,660 | $0 | $0 |
Source: Public Records
Map
Nearby Homes
- 4410 Rice Mill Dr
- 4184 Mill Creek Dr
- 8628 Windsor Hill Blvd
- 8640 Windsor Hill Blvd
- 4300 Lavender Ln
- 168 Stratton Dr
- 8319 Coventry Ct
- 8352 Coventry Ct
- 3900 Greico Rd
- 8891 E Fairway Woods Dr
- 155 Dorchester Manor Blvd Unit A & B
- 3813 Battleview Ct
- 143 Dorchester Manor Blvd
- 186 Dorchester Manor Blvd Unit A & B
- 8151 N Ridgebrook Dr
- 8152 N Ridgebrook Dr
- 20 Stratton Dr
- 4105 Senegal Ct
- 17 Stratton Dr
- 8213 N Split Oak
- 2211 Sawmill Trace Ln
- 3998 Lavender Ln
- 2207 Sawmill Trace Ln
- 1001 Saddle Creek Ct
- 2213 Sawmill Trace Ln
- 2210 Sawmill Trace Ln
- 2208 Sawmill Trace Ln
- 2212 Sawmill Trace Ln
- 2205 Sawmill Trace Ln
- 1003 Saddle Creek Ct
- 3101 Aspen Woods Ln
- 2214 Sawmill Trace Ln
- 2206 Sawmill Trace Ln
- 3992 Lavender Ln
- 1005 Saddle Creek Ct
- 3103 Aspen Woods Ln
- 2203 Sawmill Trace Ln
- 2215 Sawmill Trace Ln
- 2216 Sawmill Trace Ln
- 3100 Aspen Woods Ln