2209 Smith Dr Longmont, CO 80501
Garden Acres NeighborhoodEstimated Value: $560,146 - $644,000
5
Beds
3
Baths
3,332
Sq Ft
$181/Sq Ft
Est. Value
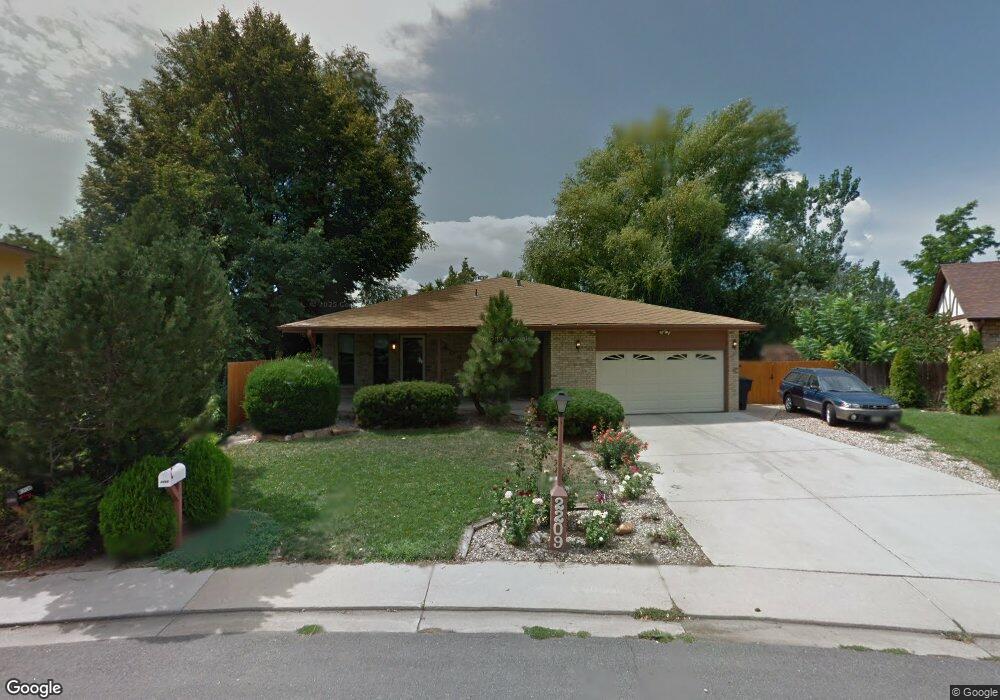
About This Home
This home is located at 2209 Smith Dr, Longmont, CO 80501 and is currently estimated at $604,537, approximately $181 per square foot. 2209 Smith Dr is a home located in Boulder County with nearby schools including Northridge Elementary School, Longs Peak Middle School, and Longmont High School.
Ownership History
Date
Name
Owned For
Owner Type
Purchase Details
Closed on
Jan 16, 2013
Sold by
Brown Christopher Scott
Bought by
Brown Christopher Scott
Current Estimated Value
Purchase Details
Closed on
Oct 20, 2011
Sold by
Settles Michael D and Settles Yvonne
Bought by
Brown Christopher Scott
Home Financials for this Owner
Home Financials are based on the most recent Mortgage that was taken out on this home.
Original Mortgage
$224,910
Outstanding Balance
$152,225
Interest Rate
4.17%
Mortgage Type
New Conventional
Estimated Equity
$452,312
Purchase Details
Closed on
Nov 30, 1994
Sold by
Minor James M and Minor Mary K
Bought by
Settles Michael D
Home Financials for this Owner
Home Financials are based on the most recent Mortgage that was taken out on this home.
Original Mortgage
$144,875
Interest Rate
7.12%
Purchase Details
Closed on
Feb 19, 1980
Bought by
Brown Christopher Scott and Simpson Courtney A
Purchase Details
Closed on
Mar 7, 1977
Bought by
Brown Christopher Scott and Simpson Courtney A
Create a Home Valuation Report for This Property
The Home Valuation Report is an in-depth analysis detailing your home's value as well as a comparison with similar homes in the area
Home Values in the Area
Average Home Value in this Area
Purchase History
| Date | Buyer | Sale Price | Title Company |
|---|---|---|---|
| Brown Christopher Scott | -- | Land Title Guarantee Company | |
| Brown Christopher Scott | $249,900 | Land Title Guarantee Company | |
| Settles Michael D | $152,500 | Stewart Title | |
| Brown Christopher Scott | $77,000 | -- | |
| Brown Christopher Scott | $57,500 | -- |
Source: Public Records
Mortgage History
| Date | Status | Borrower | Loan Amount |
|---|---|---|---|
| Open | Brown Christopher Scott | $224,910 | |
| Previous Owner | Settles Michael D | $144,875 |
Source: Public Records
Tax History
| Year | Tax Paid | Tax Assessment Tax Assessment Total Assessment is a certain percentage of the fair market value that is determined by local assessors to be the total taxable value of land and additions on the property. | Land | Improvement |
|---|---|---|---|---|
| 2025 | $3,430 | $35,787 | $6,881 | $28,906 |
| 2024 | $3,430 | $35,787 | $6,881 | $28,906 |
| 2023 | $3,383 | $35,858 | $7,725 | $31,818 |
| 2022 | $3,001 | $30,330 | $5,678 | $24,652 |
| 2021 | $3,040 | $31,203 | $5,842 | $25,361 |
| 2020 | $2,798 | $28,808 | $5,792 | $23,016 |
| 2019 | $2,754 | $28,808 | $5,792 | $23,016 |
| 2018 | $2,422 | $25,502 | $5,184 | $20,318 |
| 2017 | $2,389 | $28,194 | $5,731 | $22,463 |
| 2016 | $2,197 | $22,989 | $6,209 | $16,780 |
| 2015 | $2,094 | $18,889 | $5,970 | $12,919 |
| 2014 | $1,764 | $18,889 | $5,970 | $12,919 |
Source: Public Records
Map
Nearby Homes
- 1002 Harmon Place Unit 1002, 1004
- 2339 Pratt St
- 2024 Lincoln St
- 2140 Sherman St
- 2410 Key Ct
- 841 Crisman Dr Unit 9
- 1140 Parker Dr
- 1842 Hennington Ct
- 2412 Sherman St
- 2437 Lincoln St
- 2213 Emery St Unit C
- 1554 Ervine Ave
- 2244 Vivian St
- 1744 Lincoln St
- 1912 Rice St
- 316 21st Ave
- 1011 Yeager Dr
- 2138 Daley Dr
- 1816 Rice St
- 2109 Daley Dr
Your Personal Tour Guide
Ask me questions while you tour the home.