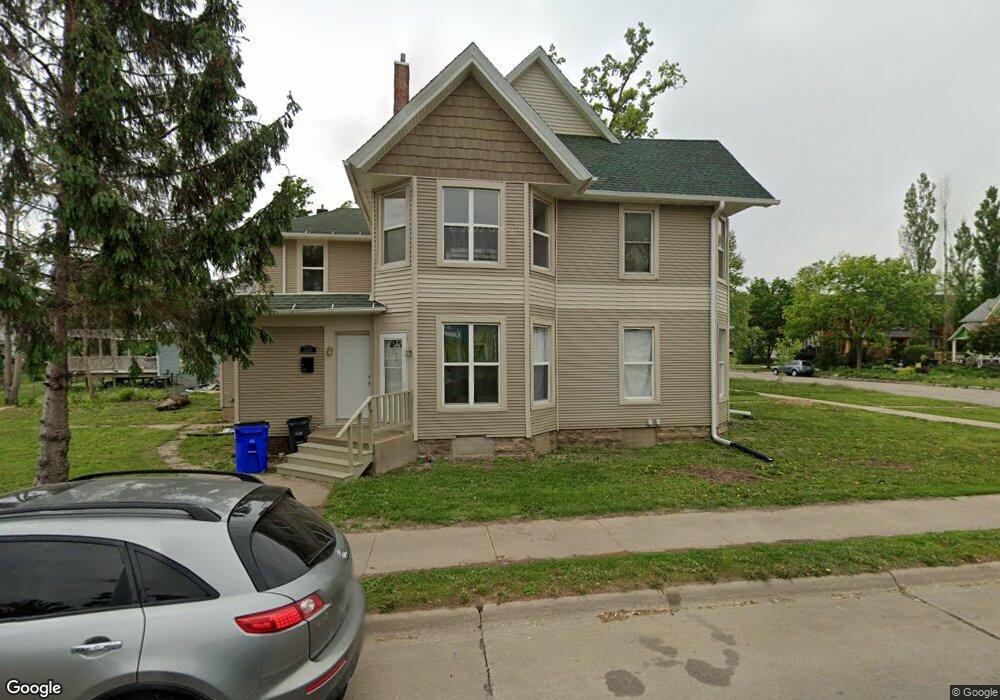
221 16th St NE Cedar Rapids, IA 52402
Mound View NeighborhoodEstimated Value: $150,000 - $180,000
5
Beds
3
Baths
2,342
Sq Ft
$70/Sq Ft
Est. Value
About This Home
This home is located at 221 16th St NE, Cedar Rapids, IA 52402 and is currently estimated at $165,000, approximately $70 per square foot. 221 16th St NE is a home with nearby schools including Garfield Elementary School, Franklin Middle School, and George Washington High School.
Ownership History
Date
Name
Owned For
Owner Type
Purchase Details
Closed on
Sep 27, 2021
Sold by
Mushrush Group Llc
Bought by
Abdille Binti and Abdille Omar Osman
Current Estimated Value
Purchase Details
Closed on
Oct 12, 2018
Sold by
Osborne Brandon T
Bought by
Mushrush Group Llc
Home Financials for this Owner
Home Financials are based on the most recent Mortgage that was taken out on this home.
Original Mortgage
$80,000
Interest Rate
4.5%
Mortgage Type
Future Advance Clause Open End Mortgage
Purchase Details
Closed on
Feb 26, 2016
Sold by
Kindl C A
Bought by
Osborne Brandon T
Home Financials for this Owner
Home Financials are based on the most recent Mortgage that was taken out on this home.
Original Mortgage
$63,600
Interest Rate
3.72%
Mortgage Type
Commercial
Purchase Details
Closed on
Dec 13, 2006
Sold by
Volkswagen Iowa City Inc
Bought by
Kindl C A
Create a Home Valuation Report for This Property
The Home Valuation Report is an in-depth analysis detailing your home's value as well as a comparison with similar homes in the area
Home Values in the Area
Average Home Value in this Area
Purchase History
| Date | Buyer | Sale Price | Title Company |
|---|---|---|---|
| Abdille Binti | $30,000 | None Available | |
| Mushrush Group Llc | $100,000 | None Available | |
| Osborne Brandon T | -- | None Available | |
| Kindl C A | -- | None Available |
Source: Public Records
Mortgage History
| Date | Status | Borrower | Loan Amount |
|---|---|---|---|
| Previous Owner | Mushrush Group Llc | $80,000 | |
| Previous Owner | Osborne Brandon T | $63,600 |
Source: Public Records
Tax History Compared to Growth
Tax History
| Year | Tax Paid | Tax Assessment Tax Assessment Total Assessment is a certain percentage of the fair market value that is determined by local assessors to be the total taxable value of land and additions on the property. | Land | Improvement |
|---|---|---|---|---|
| 2025 | $2,622 | $171,500 | $30,300 | $141,200 |
| 2024 | $2,136 | $159,100 | $30,300 | $128,800 |
| 2023 | $2,136 | $148,200 | $30,300 | $117,900 |
| 2022 | $1,426 | $101,300 | $30,300 | $71,000 |
| 2021 | $2,268 | $68,800 | $24,800 | $44,000 |
| 2020 | $2,268 | $102,800 | $22,000 | $80,800 |
| 2019 | $1,064 | $49,400 | $22,000 | $27,400 |
| 2018 | $1,416 | $49,400 | $22,000 | $27,400 |
| 2017 | $1,416 | $56,600 | $22,000 | $34,600 |
| 2016 | $1,866 | $56,600 | $22,000 | $34,600 |
| 2015 | $2,726 | $79,336 | $22,032 | $57,304 |
| 2014 | $2,726 | $62,876 | $14,580 | $48,296 |
| 2013 | $2,286 | $62,876 | $14,580 | $48,296 |
Source: Public Records
Map
Nearby Homes
- 1608 B Ave NE
- 1551 C Ave NE
- 1613 A Ave NE
- 8821 Zeppelin Ave NE
- 1703 A Ave NE
- 116 17th St NE
- 1735 C Ave NE
- 1628 2nd Ave SE
- 1748 A Ave NE
- 1746 B Ave NE
- 1517 2nd Ave SE
- 210 16th St SE
- 1514 3rd Ave SE
- 517 18th St NE
- 1416 3rd Ave SE
- 1519 Park Ave SE
- 1815 E Ave NE
- 1711 Blake Blvd SE
- 356 16th St SE
- 369 15th St SE