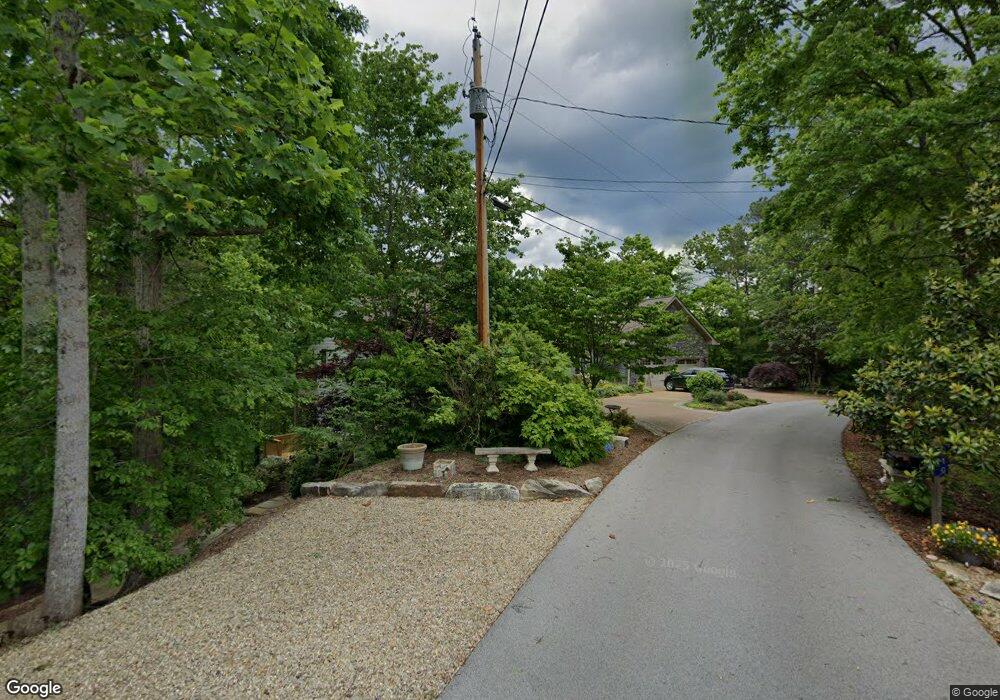
221 Brighton Trail Townsend, TN 37882
Estimated Value: $839,557 - $1,037,000
3
Beds
4
Baths
3,200
Sq Ft
$289/Sq Ft
Est. Value
About This Home
This home is located at 221 Brighton Trail, Townsend, TN 37882 and is currently estimated at $923,389, approximately $288 per square foot. 221 Brighton Trail is a home located in Blount County with nearby schools including Townsend Elementary School, Heritage Middle School, and Heritage High School.
Ownership History
Date
Name
Owned For
Owner Type
Purchase Details
Closed on
Jun 10, 2025
Sold by
Berry John S and Berry Sara P
Bought by
Berry John S and Berry Sara P
Current Estimated Value
Purchase Details
Closed on
Jul 13, 2007
Sold by
Cornerstone Custom Homes
Bought by
Berry John S
Purchase Details
Closed on
Aug 30, 2005
Sold by
Walsh Thomas E
Bought by
Corner Stone Custom Homes
Purchase Details
Closed on
Aug 23, 2005
Bought by
Cornerstone Custom Homes Llc
Purchase Details
Closed on
Feb 3, 1997
Sold by
White Oak Realty & Const
Bought by
Thomas Walsh
Purchase Details
Closed on
Apr 14, 1993
Bought by
White Oak Realty & Const Co Inc
Purchase Details
Closed on
Nov 22, 1988
Bought by
Regal Real Est Co
Purchase Details
Closed on
Mar 22, 1973
Bought by
Laurel Lake Resorts Inc
Create a Home Valuation Report for This Property
The Home Valuation Report is an in-depth analysis detailing your home's value as well as a comparison with similar homes in the area
Home Values in the Area
Average Home Value in this Area
Purchase History
| Date | Buyer | Sale Price | Title Company |
|---|---|---|---|
| Berry John S | -- | None Listed On Document | |
| Berry John S | $499,900 | -- | |
| Corner Stone Custom Homes | $80,000 | -- | |
| Cornerstone Custom Homes Llc | $85,000 | -- | |
| Thomas Walsh | $22,500 | -- | |
| White Oak Realty & Const Co Inc | -- | -- | |
| Regal Real Est Co | -- | -- | |
| Laurel Lake Resorts Inc | -- | -- |
Source: Public Records
Mortgage History
| Date | Status | Borrower | Loan Amount |
|---|---|---|---|
| Previous Owner | Bery John S | $412,000 | |
| Previous Owner | Bery John S | $50,000 | |
| Previous Owner | Cornerstone Custom Homes | $400,000 |
Source: Public Records
Tax History Compared to Growth
Tax History
| Year | Tax Paid | Tax Assessment Tax Assessment Total Assessment is a certain percentage of the fair market value that is determined by local assessors to be the total taxable value of land and additions on the property. | Land | Improvement |
|---|---|---|---|---|
| 2025 | $2,748 | $172,825 | $0 | $0 |
| 2024 | $2,748 | $172,825 | $18,750 | $154,075 |
| 2023 | $2,748 | $172,825 | $18,750 | $154,075 |
| 2022 | $3,023 | $122,400 | $15,325 | $107,075 |
| 2021 | $3,023 | $122,400 | $15,325 | $107,075 |
| 2020 | $3,023 | $122,400 | $15,325 | $107,075 |
| 2019 | $3,023 | $122,400 | $15,325 | $107,075 |
| 2018 | $3,138 | $127,025 | $26,575 | $100,450 |
| 2017 | $3,138 | $127,025 | $26,575 | $100,450 |
| 2016 | $3,138 | $127,025 | $26,575 | $100,450 |
| 2015 | $2,731 | $127,025 | $26,575 | $100,450 |
| 2014 | $2,913 | $127,025 | $26,575 | $100,450 |
| 2013 | $2,913 | $135,500 | $0 | $0 |
Source: Public Records
Map
Nearby Homes
- 117 Craig Cove
- 134 Craig Cove
- 1005 Laurel Rd
- 1148 Laurel Rd
- 822 Christy Ln
- 514 Chetola Tr
- 817 Christy Ln
- 832 Christy Ln
- 7026 Old Tuckaleechee Rd
- 491 Chetola Trail
- 483 Chetola Trail
- 103 Long Branch Rd
- 132 Cutter Gap Rd
- 419 Mountain Thrush Dr
- 7062 E Lamar Alexander Pkwy
- 610 Whistling Swan St
- 123 Cutter Gap Rd
- 621 Whistling Swan St
- 114 Cutter Gap Rd
- 758 Big Valley Blvd
- 210 Brighton Trail
- 222 Brighton Trail
- 105 Craig Cove
- 230 Brighton Trail
- 0 Brighton Terrace Unit 961947
- 0 Brighton Terrace Unit 1152932
- 3148 Laurel Rd
- 202 Brighton Trail
- Lot 21 Craig Cove
- 21 Craig Cove
- 104 Craig Cove
- 116 Craig Cove
- 120 Craig Cove
- 1116 Laurel Rd
- 1112 Laurel Rd
- 107 Big John Cove
- 101 Big John Cove
- 745 Sister Trail
- 718 Sister Trail
- 744 Sister Trail