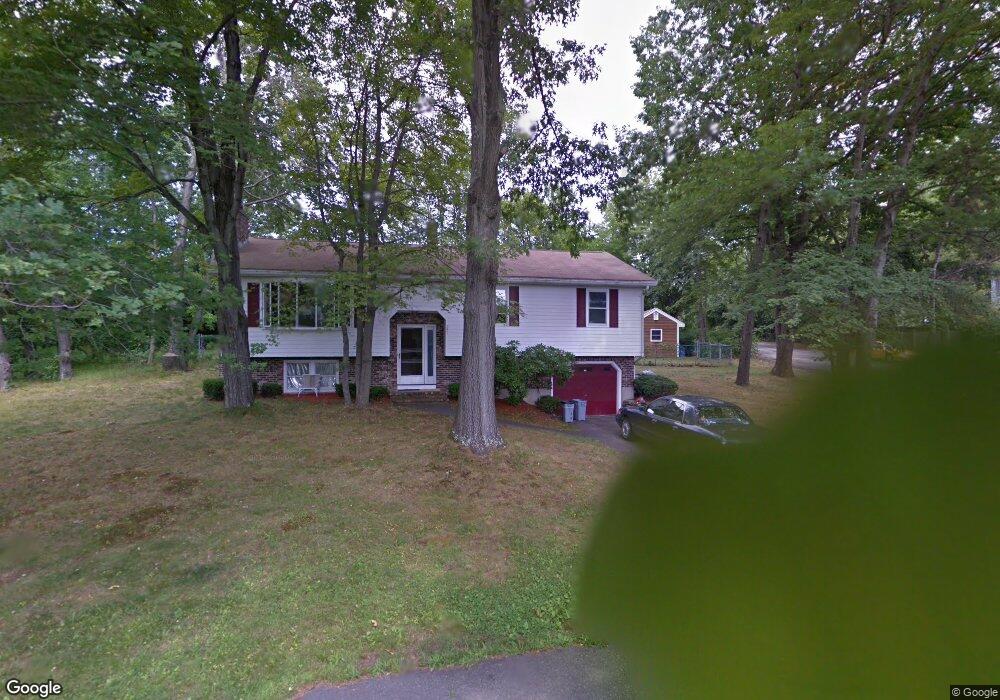
221 Brook St Haverhill, MA 01832
Broad Hill NeighborhoodEstimated Value: $579,782 - $632,000
2
Beds
3
Baths
2,100
Sq Ft
$291/Sq Ft
Est. Value
About This Home
This home is located at 221 Brook St, Haverhill, MA 01832 and is currently estimated at $611,696, approximately $291 per square foot. 221 Brook St is a home located in Essex County with nearby schools including Tilton Elementary School and Silver Hill Elementary School.
Ownership History
Date
Name
Owned For
Owner Type
Purchase Details
Closed on
Jun 25, 2010
Sold by
Chasse James P and Chasse Gemma A
Bought by
Chasse James P and Chasse Gemma A
Current Estimated Value
Purchase Details
Closed on
Oct 16, 1987
Sold by
Antonelli Frank
Bought by
Chasse James P
Home Financials for this Owner
Home Financials are based on the most recent Mortgage that was taken out on this home.
Original Mortgage
$124,000
Interest Rate
10.63%
Mortgage Type
Purchase Money Mortgage
Create a Home Valuation Report for This Property
The Home Valuation Report is an in-depth analysis detailing your home's value as well as a comparison with similar homes in the area
Home Values in the Area
Average Home Value in this Area
Purchase History
| Date | Buyer | Sale Price | Title Company |
|---|---|---|---|
| Chasse James P | -- | -- | |
| Chasse James P | $155,000 | -- |
Source: Public Records
Mortgage History
| Date | Status | Borrower | Loan Amount |
|---|---|---|---|
| Previous Owner | Chasse James P | $100,000 | |
| Previous Owner | Chasse James P | $124,000 |
Source: Public Records
Tax History Compared to Growth
Tax History
| Year | Tax Paid | Tax Assessment Tax Assessment Total Assessment is a certain percentage of the fair market value that is determined by local assessors to be the total taxable value of land and additions on the property. | Land | Improvement |
|---|---|---|---|---|
| 2025 | $5,179 | $483,600 | $192,000 | $291,600 |
| 2024 | $4,828 | $453,800 | $175,200 | $278,600 |
| 2023 | $4,778 | $428,500 | $175,200 | $253,300 |
| 2022 | $4,708 | $370,100 | $160,000 | $210,100 |
| 2021 | $4,649 | $345,900 | $149,900 | $196,000 |
| 2020 | $4,613 | $339,200 | $143,200 | $196,000 |
| 2019 | $4,474 | $320,700 | $124,700 | $196,000 |
| 2018 | $4,224 | $296,200 | $117,900 | $178,300 |
| 2017 | $4,239 | $282,800 | $114,600 | $168,200 |
| 2016 | $4,187 | $272,600 | $104,400 | $168,200 |
| 2015 | $4,046 | $263,600 | $104,400 | $159,200 |
Source: Public Records
Map
Nearby Homes
- 83 Standish Rd
- 16 Standish Rd
- 2 N Broadway
- 114 N Broadway
- 291 Broadway Unit D
- 5 Sherman Ave
- 226 Monument St
- 19 Greenhill Farm Rd
- 21 Eudora St
- 70 Casablanca Ct Unit 70
- 99 Blaisdell St Unit C
- 97-99 Blaisdell St Unit 2
- 134 Warrenton Rd
- 39 Boston St Unit 39
- 110 Pilling St
- 43 Boston St Unit 43
- 40 Bellevue Ave Unit 42
- 54 Observatory Ave
- 23 Lewis St
- 11 York St Unit 11