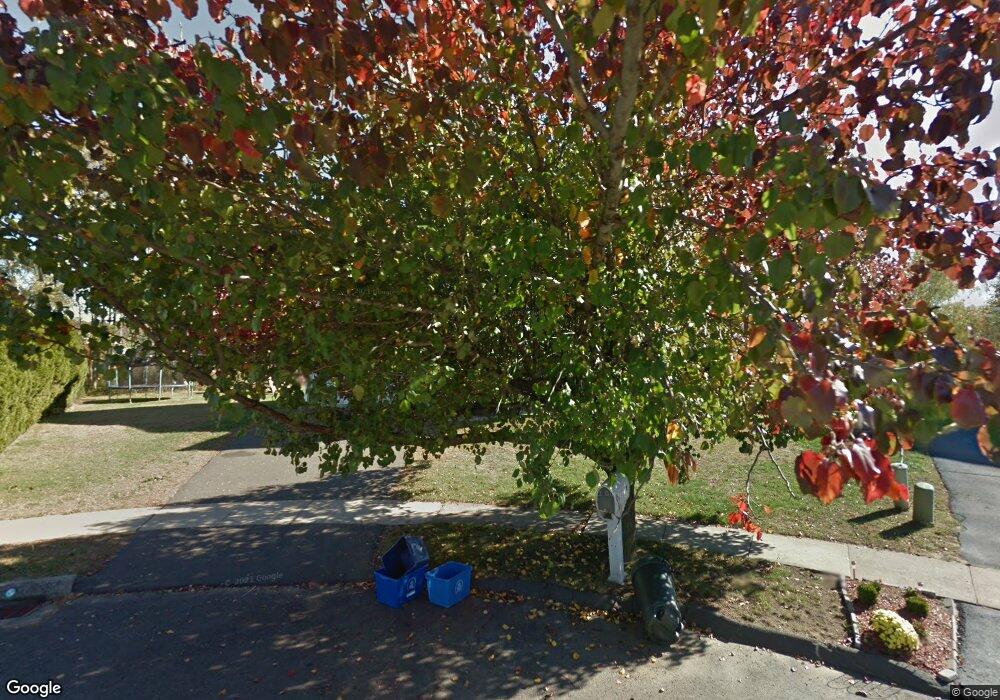
221 Captains Walk Stratford, CT 06614
Estimated Value: $707,579 - $794,000
4
Beds
3
Baths
2,300
Sq Ft
$326/Sq Ft
Est. Value
About This Home
This home is located at 221 Captains Walk, Stratford, CT 06614 and is currently estimated at $750,145, approximately $326 per square foot. 221 Captains Walk is a home located in Fairfield County with nearby schools including Wilcoxson Elementary School, David Wooster Middle School, and Stratford High School.
Ownership History
Date
Name
Owned For
Owner Type
Purchase Details
Closed on
Jan 16, 2002
Sold by
Lindsay John S and Lindsay Lisa K
Bought by
Terlik W David and Terlik Dina
Current Estimated Value
Home Financials for this Owner
Home Financials are based on the most recent Mortgage that was taken out on this home.
Original Mortgage
$256,000
Interest Rate
6.84%
Purchase Details
Closed on
Dec 20, 2000
Sold by
Bafford Joseph R and Bafford Kimbly
Bought by
Lindsey John S and Lindsey Lisa K
Home Financials for this Owner
Home Financials are based on the most recent Mortgage that was taken out on this home.
Original Mortgage
$251,200
Interest Rate
7.71%
Purchase Details
Closed on
Mar 19, 1999
Sold by
Mtm Classic Home Bldrs
Bought by
Bufford Joe R and Bufford Kimberly
Purchase Details
Closed on
Jul 23, 1997
Sold by
Nihe Corp
Bought by
Mtm Classic Home Bldrs
Create a Home Valuation Report for This Property
The Home Valuation Report is an in-depth analysis detailing your home's value as well as a comparison with similar homes in the area
Home Values in the Area
Average Home Value in this Area
Purchase History
| Date | Buyer | Sale Price | Title Company |
|---|---|---|---|
| Terlik W David | $320,000 | -- | |
| Lindsey John S | $314,000 | -- | |
| Bufford Joe R | $285,750 | -- | |
| Mtm Classic Home Bldrs | $400,000 | -- |
Source: Public Records
Mortgage History
| Date | Status | Borrower | Loan Amount |
|---|---|---|---|
| Open | Mtm Classic Home Bldrs | $253,700 | |
| Closed | Mtm Classic Home Bldrs | $256,000 | |
| Previous Owner | Mtm Classic Home Bldrs | $251,200 | |
| Previous Owner | Mtm Classic Home Bldrs | $242,887 |
Source: Public Records
Tax History Compared to Growth
Tax History
| Year | Tax Paid | Tax Assessment Tax Assessment Total Assessment is a certain percentage of the fair market value that is determined by local assessors to be the total taxable value of land and additions on the property. | Land | Improvement |
|---|---|---|---|---|
| 2025 | $11,607 | $288,720 | $113,440 | $175,280 |
| 2024 | $11,607 | $288,720 | $113,440 | $175,280 |
| 2023 | $11,607 | $288,720 | $113,440 | $175,280 |
| 2022 | $11,393 | $288,720 | $113,440 | $175,280 |
| 2021 | $11,371 | $288,090 | $113,440 | $174,650 |
| 2020 | $11,420 | $288,090 | $113,440 | $174,650 |
| 2019 | $12,200 | $306,000 | $121,060 | $184,940 |
| 2018 | $12,209 | $306,000 | $121,060 | $184,940 |
| 2017 | $12,231 | $306,000 | $121,060 | $184,940 |
| 2016 | $11,931 | $306,000 | $121,060 | $184,940 |
| 2015 | $11,316 | $306,000 | $121,060 | $184,940 |
| 2014 | $11,787 | $330,820 | $102,410 | $228,410 |
Source: Public Records
Map
Nearby Homes
- 120 Bittersweet Ln
- 45 Hall Rd
- 709 E Main St
- 515 Wilcoxson Ave
- 525 Wilcoxson Ave
- 86 Bridgeview Place
- 55 Reed St
- 169 Laughlin Rd E
- 81 Newton St
- 715 Wilcoxson Ave
- 100 Matthew Dr
- 21 Ormond St
- 23 Utica St
- 45 Queens Ave
- 83 Berwyn St
- 25 Glenwood Ave
- 18 Greenview Ln
- 0 Thornton St
- 35 Paradise Ct
- 1234 Windward Rd
- 200 Captains Walk
- 181 Captains Walk
- 180 Captains Walk
- 160 Captains Walk
- 140 Captains Walk
- 155 Ward St
- 161 Captains Walk
- 300 Brookside Dr
- 141 Captains Walk
- 120 Captains Walk
- 121 Captains Walk
- 74 Platt St
- 175 Bittersweet Ln
- 84 Ward St
- 125 Ward St
- 80 Ward St
- 93 Ward St
- 56 Platt St
- 67 Platt St
- 275 Brookside Dr