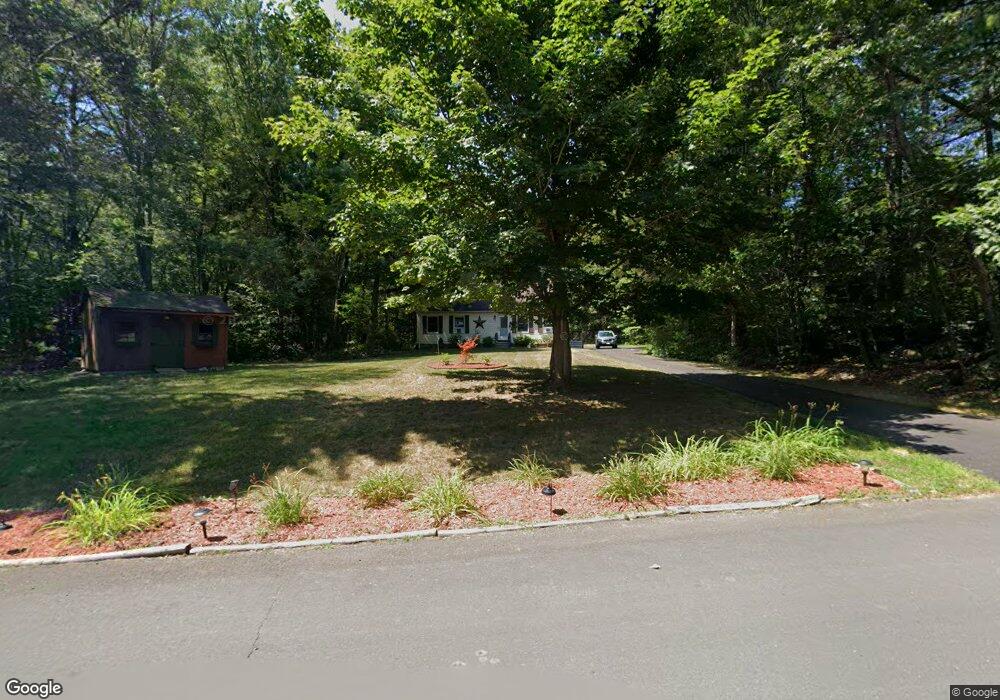
221 Dana Rd Orange, MA 01364
Estimated Value: $330,000 - $389,000
2
Beds
1
Bath
1,440
Sq Ft
$254/Sq Ft
Est. Value
About This Home
This home is located at 221 Dana Rd, Orange, MA 01364 and is currently estimated at $365,688, approximately $253 per square foot. 221 Dana Rd is a home located in Franklin County with nearby schools including Fisher Hill and Ralph C Mahar Regional School.
Ownership History
Date
Name
Owned For
Owner Type
Purchase Details
Closed on
Mar 21, 2005
Sold by
Mills Joanne P
Bought by
Gale Keith A
Current Estimated Value
Purchase Details
Closed on
May 10, 2000
Sold by
Euvrard Christopher A and Euvrard Megan M
Bought by
Mills Joanne P
Purchase Details
Closed on
Dec 30, 1994
Sold by
Citicorp Mrt Inc
Bought by
Euvrard Christopher A and Euvrard Megan M
Purchase Details
Closed on
Sep 14, 1994
Sold by
Bennett Randy J
Bought by
Citicorp Mtg Inc Of Ma
Create a Home Valuation Report for This Property
The Home Valuation Report is an in-depth analysis detailing your home's value as well as a comparison with similar homes in the area
Home Values in the Area
Average Home Value in this Area
Purchase History
| Date | Buyer | Sale Price | Title Company |
|---|---|---|---|
| Gale Keith A | -- | -- | |
| Mills Joanne P | $99,900 | -- | |
| Euvrard Christopher A | $64,000 | -- | |
| Citicorp Mtg Inc Of Ma | $51,800 | -- |
Source: Public Records
Mortgage History
| Date | Status | Borrower | Loan Amount |
|---|---|---|---|
| Open | Citicorp Mtg Inc Of Ma | $135,000 | |
| Previous Owner | Citicorp Mtg Inc Of Ma | $110,000 | |
| Previous Owner | Citicorp Mtg Inc Of Ma | $84,800 |
Source: Public Records
Tax History Compared to Growth
Tax History
| Year | Tax Paid | Tax Assessment Tax Assessment Total Assessment is a certain percentage of the fair market value that is determined by local assessors to be the total taxable value of land and additions on the property. | Land | Improvement |
|---|---|---|---|---|
| 2025 | $5,271 | $320,400 | $38,300 | $282,100 |
| 2024 | $4,313 | $247,300 | $38,300 | $209,000 |
| 2023 | $3,567 | $198,600 | $38,300 | $160,300 |
| 2022 | $3,585 | $187,500 | $38,300 | $149,200 |
| 2021 | $3,679 | $183,500 | $59,700 | $123,800 |
| 2020 | $3,694 | $181,700 | $59,200 | $122,500 |
| 2019 | $3,599 | $159,800 | $53,100 | $106,700 |
| 2018 | $3,638 | $165,800 | $60,300 | $105,500 |
| 2017 | $3,520 | $165,800 | $60,300 | $105,500 |
| 2016 | $3,238 | $149,200 | $52,300 | $96,900 |
| 2015 | $3,116 | $150,000 | $52,300 | $97,700 |
| 2014 | $3,006 | $152,300 | $52,300 | $100,000 |
Source: Public Records
Map
Nearby Homes