Estimated Value: $589,166 - $763,000
5
Beds
3
Baths
3,554
Sq Ft
$180/Sq Ft
Est. Value
About This Home
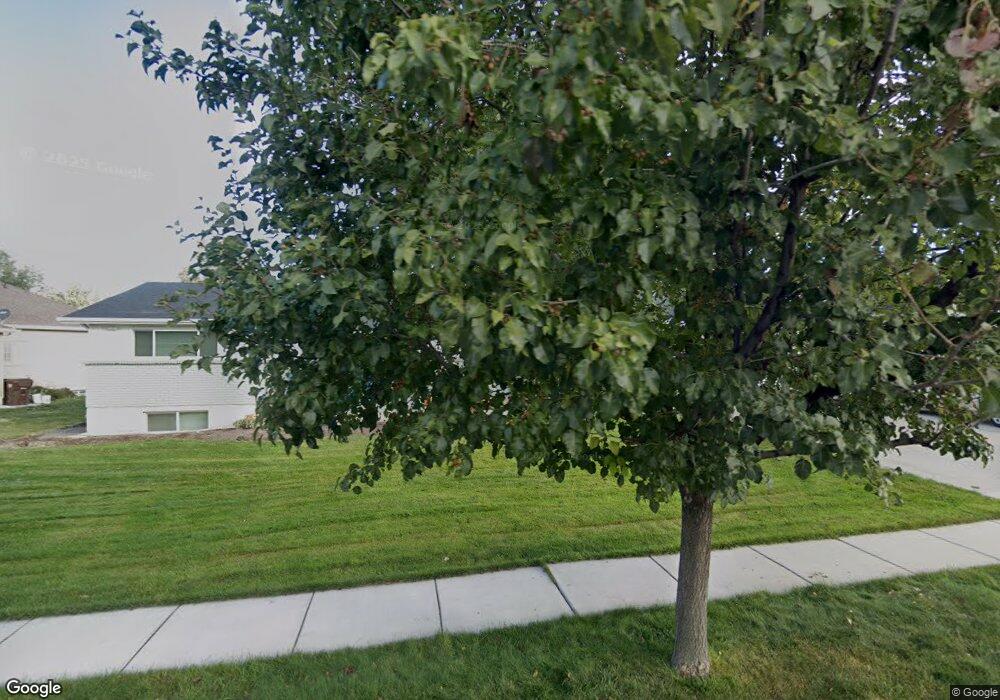
This home is located at 221 E 8135 S, Sandy, UT 84070 and is currently estimated at $641,042, approximately $180 per square foot. 221 E 8135 S is a home located in Salt Lake County with nearby schools including Midvalley Elementary School, Union Middle School, and Hillcrest High School.
Ownership History
Date
Name
Owned For
Owner Type
Purchase Details
Closed on
Mar 15, 2021
Sold by
Bell Matthew E and Bell Shoshawna Ashleyy
Bought by
Bell Matthew and Bell Shoshawna
Current Estimated Value
Home Financials for this Owner
Home Financials are based on the most recent Mortgage that was taken out on this home.
Original Mortgage
$340,000
Outstanding Balance
$304,786
Interest Rate
2.7%
Mortgage Type
New Conventional
Estimated Equity
$336,256
Purchase Details
Closed on
May 28, 2013
Sold by
Hwl Larson Cove Llc
Bought by
Bell Matthew E and Bell Shoshawna Ashley
Home Financials for this Owner
Home Financials are based on the most recent Mortgage that was taken out on this home.
Original Mortgage
$231,725
Interest Rate
3.38%
Mortgage Type
FHA
Purchase Details
Closed on
Dec 10, 2003
Sold by
Tarbet Floyd L and Tarbet Karen L
Bought by
Tarbet Floyd L and Tarbet Karen L
Create a Home Valuation Report for This Property
The Home Valuation Report is an in-depth analysis detailing your home's value as well as a comparison with similar homes in the area
Home Values in the Area
Average Home Value in this Area
Purchase History
| Date | Buyer | Sale Price | Title Company |
|---|---|---|---|
| Bell Matthew | -- | Citadel Title & Escrow | |
| Bell Matthew E | -- | Title Guarantee | |
| Tarbet Floyd L | -- | -- | |
| Tarbet Floyd L | -- | -- |
Source: Public Records
Mortgage History
| Date | Status | Borrower | Loan Amount |
|---|---|---|---|
| Open | Bell Matthew | $340,000 | |
| Closed | Bell Matthew E | $231,725 |
Source: Public Records
Tax History
| Year | Tax Paid | Tax Assessment Tax Assessment Total Assessment is a certain percentage of the fair market value that is determined by local assessors to be the total taxable value of land and additions on the property. | Land | Improvement |
|---|---|---|---|---|
| 2025 | $3,078 | $523,000 | $233,200 | $289,800 |
| 2024 | $3,078 | $505,400 | $218,000 | $287,400 |
| 2023 | $2,895 | $470,900 | $207,300 | $263,600 |
| 2022 | $3,080 | $489,400 | $203,200 | $286,200 |
| 2021 | $2,861 | $388,700 | $173,700 | $215,000 |
| 2020 | $2,582 | $332,000 | $173,700 | $158,300 |
| 2019 | $2,629 | $329,300 | $163,900 | $165,400 |
| 2016 | $2,278 | $269,000 | $163,900 | $105,100 |
Source: Public Records
Map
Nearby Homes
- 274 E Water Mill Way Unit 230
- 257 Water Mill Way Unit 211
- 257 E Water Mill Way
- 135 E Station St
- 8264 S Resaca Dr Unit K9
- 116 E Resaca Dr Unit F2
- 8278 S Resaca Dr Unit L1
- 190 E White Spruce Cove Unit 805
- 144 E Chambord Ct
- 140 E Chambord Ct
- 138 E Chambord Ct
- 136 E Chambord Ct
- 132 E Chambord Ct
- 117 E Calbourne Ln Unit I4
- 8229 S Resaca Dr Unit D3
- 90 E Resaca Dr Unit C11
- 74 E Resaca Dr Unit B12
- 393 E Corral Creek Dr
- 379 E Horse Creek Dr
- 359 E 8400 S
Your Personal Tour Guide
Ask me questions while you tour the home.