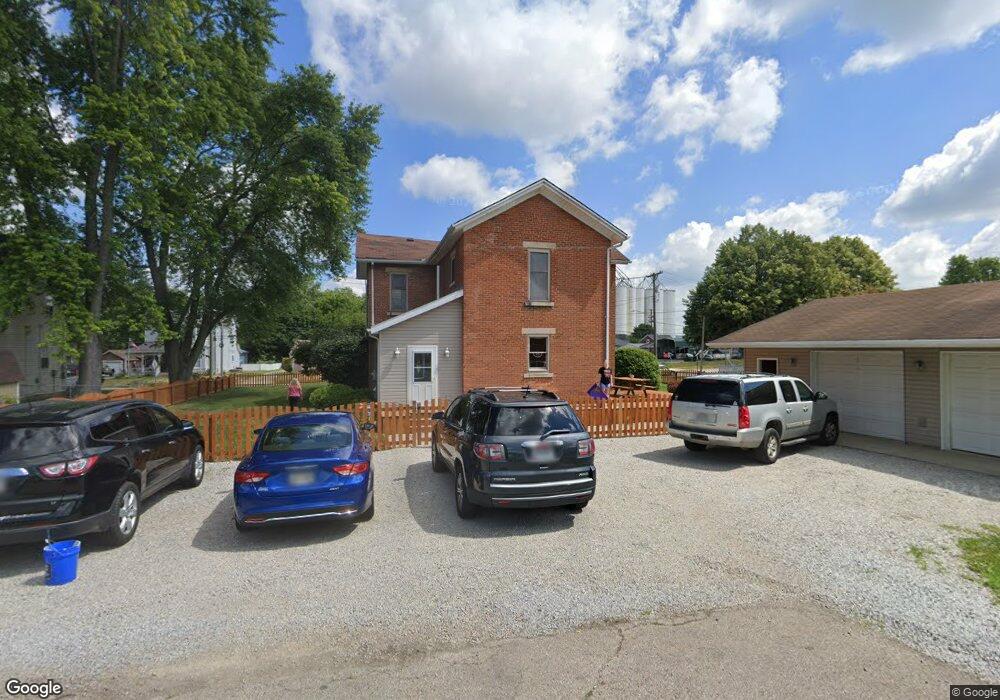
221 E Broadway St Covington, OH 45318
Estimated Value: $267,000 - $349,000
4
Beds
2
Baths
2,768
Sq Ft
$113/Sq Ft
Est. Value
About This Home
This home is located at 221 E Broadway St, Covington, OH 45318 and is currently estimated at $313,236, approximately $113 per square foot. 221 E Broadway St is a home located in Miami County with nearby schools including Covington Elementary/Junior High School, Covington Junior High School, and Covington High School.
Ownership History
Date
Name
Owned For
Owner Type
Purchase Details
Closed on
Dec 18, 2024
Sold by
Stacy Ben S and Stacy Heather L
Bought by
Renner Philip J and Renner Ashley R
Current Estimated Value
Home Financials for this Owner
Home Financials are based on the most recent Mortgage that was taken out on this home.
Original Mortgage
$165,900
Outstanding Balance
$163,457
Interest Rate
5.88%
Mortgage Type
Credit Line Revolving
Estimated Equity
$149,779
Purchase Details
Closed on
Dec 19, 2002
Sold by
Swartz Douglas K and Swartz Rhonda L
Bought by
Stacy Ben S and Stach Heather L
Home Financials for this Owner
Home Financials are based on the most recent Mortgage that was taken out on this home.
Original Mortgage
$144,900
Interest Rate
6.23%
Mortgage Type
New Conventional
Purchase Details
Closed on
Mar 25, 1991
Bought by
Swartz Douglas K
Create a Home Valuation Report for This Property
The Home Valuation Report is an in-depth analysis detailing your home's value as well as a comparison with similar homes in the area
Home Values in the Area
Average Home Value in this Area
Purchase History
| Date | Buyer | Sale Price | Title Company |
|---|---|---|---|
| Renner Philip J | $255,900 | None Listed On Document | |
| Stacy Ben S | $155,900 | -- | |
| Swartz Douglas K | $45,000 | -- |
Source: Public Records
Mortgage History
| Date | Status | Borrower | Loan Amount |
|---|---|---|---|
| Open | Renner Philip J | $165,900 | |
| Previous Owner | Stacy Ben S | $144,900 |
Source: Public Records
Tax History
| Year | Tax Paid | Tax Assessment Tax Assessment Total Assessment is a certain percentage of the fair market value that is determined by local assessors to be the total taxable value of land and additions on the property. | Land | Improvement |
|---|---|---|---|---|
| 2025 | $2,924 | $89,570 | $13,830 | $75,740 |
| 2024 | $2,924 | $85,190 | $14,980 | $70,210 |
| 2023 | $3,191 | $85,190 | $14,980 | $70,210 |
| 2022 | $3,182 | $85,190 | $14,980 | $70,210 |
| 2021 | $2,643 | $65,530 | $11,520 | $54,010 |
| 2020 | $2,649 | $65,530 | $11,520 | $54,010 |
| 2019 | $2,661 | $65,530 | $11,520 | $54,010 |
| 2018 | $2,287 | $56,210 | $9,100 | $47,110 |
| 2017 | $2,328 | $56,210 | $9,100 | $47,110 |
| 2016 | $2,298 | $56,210 | $9,100 | $47,110 |
| 2015 | $2,117 | $54,040 | $8,750 | $45,290 |
| 2014 | $2,117 | $54,040 | $8,750 | $45,290 |
| 2013 | $2,038 | $54,040 | $8,750 | $45,290 |
Source: Public Records
Map
Nearby Homes
- 215 E Broadway St
- 301 Chestnut St
- 301 College St
- 307 N Grant St
- 231 E Broadway St
- 203 E Broadway St
- 224 E Broadway St
- 222 E Broadway St
- 222 E Broadway St Unit Covington
- 220 E Broadway St
- 261 College St
- 250 College St
- 260 N Wall St
- 210 E Broadway St
- 303 N Grant St
- 243 E Broadway St
- 255 College St
- 254 N Wall St
- 246 College St
- 200 E Broadway St
Your Personal Tour Guide
Ask me questions while you tour the home.