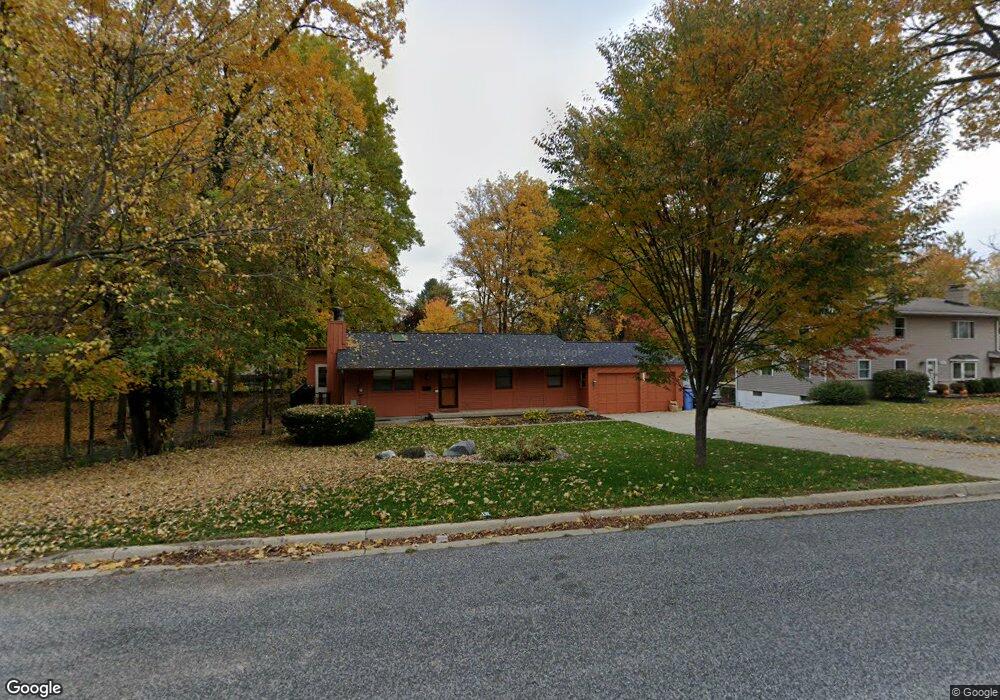
221 E Northrup St Lansing, MI 48911
Southern Lansing NeighborhoodEstimated Value: $176,203 - $212,000
--
Bed
--
Bath
1,300
Sq Ft
$149/Sq Ft
Est. Value
About This Home
This home is located at 221 E Northrup St, Lansing, MI 48911 and is currently estimated at $194,051, approximately $149 per square foot. 221 E Northrup St is a home located in Ingham County with nearby schools including Kendon School, Attwood School, and Everett High School.
Ownership History
Date
Name
Owned For
Owner Type
Purchase Details
Closed on
Jun 26, 1997
Sold by
Lewis Elizabeth A
Bought by
Cornish Rowland E
Current Estimated Value
Create a Home Valuation Report for This Property
The Home Valuation Report is an in-depth analysis detailing your home's value as well as a comparison with similar homes in the area
Home Values in the Area
Average Home Value in this Area
Purchase History
| Date | Buyer | Sale Price | Title Company |
|---|---|---|---|
| Cornish Rowland E | $100,000 | -- |
Source: Public Records
Tax History Compared to Growth
Tax History
| Year | Tax Paid | Tax Assessment Tax Assessment Total Assessment is a certain percentage of the fair market value that is determined by local assessors to be the total taxable value of land and additions on the property. | Land | Improvement |
|---|---|---|---|---|
| 2025 | $3,809 | $82,200 | $15,400 | $66,800 |
| 2024 | $30 | $71,200 | $15,400 | $55,800 |
| 2023 | $3,570 | $65,700 | $15,400 | $50,300 |
| 2022 | $3,216 | $60,400 | $15,400 | $45,000 |
| 2021 | $3,149 | $62,100 | $12,900 | $49,200 |
| 2020 | $3,130 | $57,800 | $12,900 | $44,900 |
| 2019 | $3,002 | $53,500 | $12,900 | $40,600 |
| 2018 | $2,812 | $50,900 | $12,900 | $38,000 |
| 2017 | $2,692 | $50,900 | $12,900 | $38,000 |
| 2016 | $2,641 | $47,600 | $12,900 | $34,700 |
| 2015 | $2,641 | $46,800 | $25,842 | $20,958 |
| 2014 | $2,641 | $47,300 | $31,995 | $15,305 |
Source: Public Records
Map
Nearby Homes
- 129 Village Dr
- 5727 Annapolis Dr
- 5636 Ellendale Dr
- 5011 Stafford Ave
- 5751 Joshua St
- 5724 Orchard Ct
- 6029 Ellendale Dr
- 5821 Schafer Rd
- 5750 Orchard Ct
- 5808 Orchard Ct
- 354 E Miller Rd
- 201 E Syringa Dr
- 4922 Southgate Ave
- 4800 Ora St
- 105 Cox Blvd
- 111 E Potter Ave
- 1101 Barr Ave
- 1014 W Northrup St
- 201 W Graham Ave
- 5006 Delbrook Ave