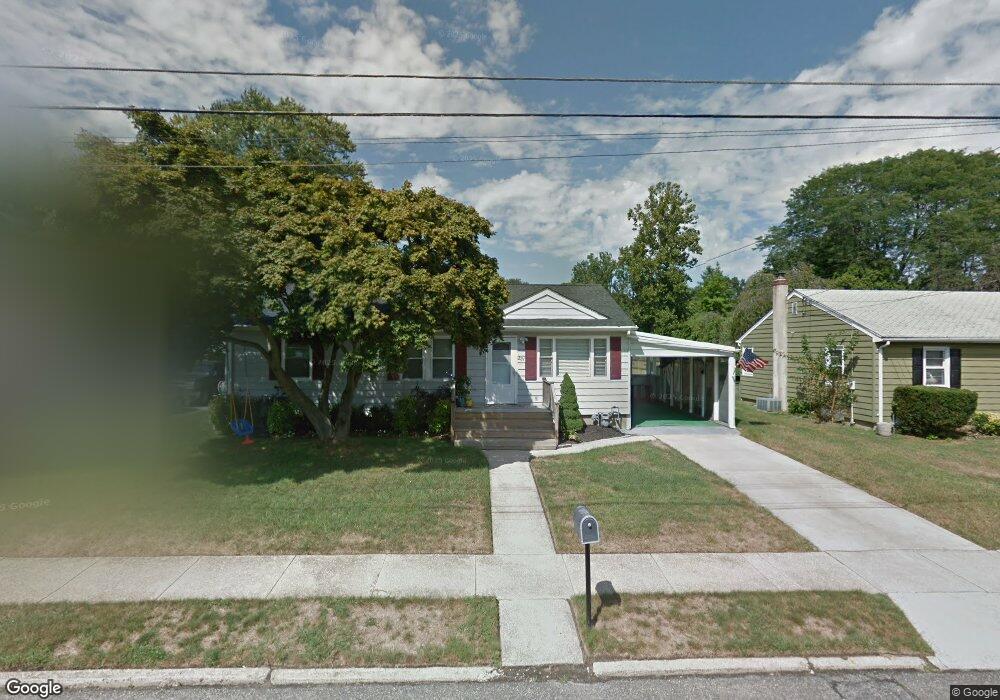
221 Laurel Place Neptune, NJ 07753
Estimated Value: $454,000 - $555,687
3
Beds
2
Baths
1,188
Sq Ft
$442/Sq Ft
Est. Value
About This Home
This home is located at 221 Laurel Place, Neptune, NJ 07753 and is currently estimated at $524,922, approximately $441 per square foot. 221 Laurel Place is a home located in Monmouth County with nearby schools including Neptune High School.
Ownership History
Date
Name
Owned For
Owner Type
Purchase Details
Closed on
Dec 10, 2018
Sold by
Julio Jason and Julio Maria
Bought by
Loch Deanna
Current Estimated Value
Home Financials for this Owner
Home Financials are based on the most recent Mortgage that was taken out on this home.
Original Mortgage
$293,040
Interest Rate
4.87%
Mortgage Type
FHA
Purchase Details
Closed on
Apr 1, 2010
Sold by
Primacy Closing Corporation
Bought by
Julio Jason and Florez Maria
Home Financials for this Owner
Home Financials are based on the most recent Mortgage that was taken out on this home.
Original Mortgage
$284,747
Interest Rate
5.5%
Mortgage Type
FHA
Purchase Details
Closed on
Sep 25, 2009
Sold by
Hosley Loring F and Hosley Lisa
Bought by
Primacy Closing Corporation
Purchase Details
Closed on
Apr 28, 2003
Sold by
Otto Marie
Bought by
Hosley Loring and Hosley Jodi
Home Financials for this Owner
Home Financials are based on the most recent Mortgage that was taken out on this home.
Original Mortgage
$203,425
Interest Rate
5.82%
Create a Home Valuation Report for This Property
The Home Valuation Report is an in-depth analysis detailing your home's value as well as a comparison with similar homes in the area
Home Values in the Area
Average Home Value in this Area
Purchase History
| Date | Buyer | Sale Price | Title Company |
|---|---|---|---|
| Loch Deanna | $320,000 | Trident Abstract Title Agenc | |
| Loch Deanna M | $320,000 | Trident Abstract Title Agenc | |
| Julio Jason | $290,000 | None Available | |
| Primacy Closing Corporation | $290,000 | None Available | |
| Hosley Loring | $197,500 | -- |
Source: Public Records
Mortgage History
| Date | Status | Borrower | Loan Amount |
|---|---|---|---|
| Previous Owner | Loch Deanna M | $293,040 | |
| Previous Owner | Julio Jason | $284,747 | |
| Previous Owner | Hosley Loring | $203,425 |
Source: Public Records
Tax History Compared to Growth
Tax History
| Year | Tax Paid | Tax Assessment Tax Assessment Total Assessment is a certain percentage of the fair market value that is determined by local assessors to be the total taxable value of land and additions on the property. | Land | Improvement |
|---|---|---|---|---|
| 2025 | $8,876 | $545,800 | $256,400 | $289,400 |
| 2024 | $7,768 | $506,900 | $222,800 | $284,100 |
| 2023 | $7,768 | $430,100 | $173,400 | $256,700 |
| 2022 | $7,178 | $394,900 | $152,300 | $242,600 |
| 2021 | $5,412 | $339,700 | $153,200 | $186,500 |
| 2020 | $6,858 | $323,800 | $147,100 | $176,700 |
| 2019 | $5,412 | $252,300 | $116,100 | $136,200 |
| 2018 | $5,453 | $251,300 | $116,100 | $135,200 |
| 2017 | $5,616 | $248,600 | $115,100 | $133,500 |
| 2016 | $5,468 | $241,400 | $110,100 | $131,300 |
| 2015 | $5,046 | $226,600 | $98,500 | $128,100 |
| 2014 | $5,272 | $194,600 | $88,500 | $106,100 |
Source: Public Records
Map
Nearby Homes
- 223 Laurel Place
- 219 Laurel Place
- 216 Maple Ave
- 218 Maple Ave
- 217 Laurel Place
- 225 Laurel Place
- 214 Maple Ave
- 220 Maple Ave
- 222 Laurel Place
- 220 Laurel Place
- 224 Laurel Place
- 215 Laurel Place
- 212 Maple Ave
- 227 Laurel Place
- 218 Laurel Place
- 226 Laurel Place
- 222 Maple Ave
- 228 Laurel Place
- 210 Maple Ave
- 216 Laurel Place