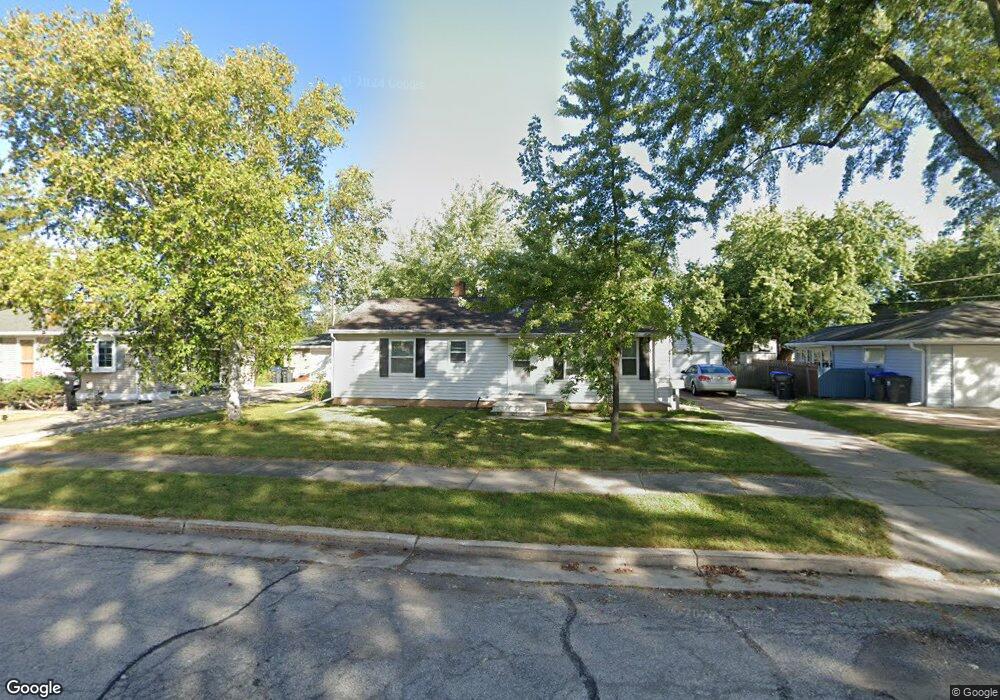
221 Meade St Neenah, WI 54956
Estimated Value: $202,000 - $225,474
3
Beds
1
Bath
1,008
Sq Ft
$207/Sq Ft
Est. Value
About This Home
This home is located at 221 Meade St, Neenah, WI 54956 and is currently estimated at $208,869, approximately $207 per square foot. 221 Meade St is a home located in Winnebago County with nearby schools including Horace Mann Middle School, Horace Mann Elementary School, and Neenah Middle School.
Ownership History
Date
Name
Owned For
Owner Type
Purchase Details
Closed on
May 15, 2020
Sold by
Siebers Gregory S and Siebers Kathy L
Bought by
Labby Alexander F
Current Estimated Value
Home Financials for this Owner
Home Financials are based on the most recent Mortgage that was taken out on this home.
Original Mortgage
$106,700
Outstanding Balance
$94,462
Interest Rate
3.25%
Mortgage Type
New Conventional
Estimated Equity
$114,407
Purchase Details
Closed on
Oct 1, 2018
Sold by
Albright Andrew J and Albright Elizabeth J
Bought by
Tarr Alison
Home Financials for this Owner
Home Financials are based on the most recent Mortgage that was taken out on this home.
Original Mortgage
$16,915
Interest Rate
4.5%
Mortgage Type
Unknown
Purchase Details
Closed on
Oct 13, 2014
Sold by
Siebers Carol M and Scheffler Carol M
Bought by
Siebers Gregory S and Siebers Kathy L
Purchase Details
Closed on
Dec 22, 2005
Sold by
Siebers Carol M
Bought by
Siebers Gregory S and Siebers Kathy L
Create a Home Valuation Report for This Property
The Home Valuation Report is an in-depth analysis detailing your home's value as well as a comparison with similar homes in the area
Home Values in the Area
Average Home Value in this Area
Purchase History
| Date | Buyer | Sale Price | Title Company |
|---|---|---|---|
| Labby Alexander F | $110,000 | None Available | |
| Tarr Alison | $150,000 | None Available | |
| Siebers Gregory S | $100,000 | None Available | |
| Siebers Gregory S | $100,000 | -- |
Source: Public Records
Mortgage History
| Date | Status | Borrower | Loan Amount |
|---|---|---|---|
| Open | Labby Alexander F | $106,700 | |
| Previous Owner | Tarr Alison | $16,915 |
Source: Public Records
Tax History Compared to Growth
Tax History
| Year | Tax Paid | Tax Assessment Tax Assessment Total Assessment is a certain percentage of the fair market value that is determined by local assessors to be the total taxable value of land and additions on the property. | Land | Improvement |
|---|---|---|---|---|
| 2024 | $2,153 | $148,500 | $28,500 | $120,000 |
| 2023 | $2,153 | $148,500 | $28,500 | $120,000 |
| 2022 | $2,102 | $110,200 | $26,500 | $83,700 |
| 2021 | $2,130 | $110,200 | $26,500 | $83,700 |
| 2020 | $2,201 | $110,200 | $26,500 | $83,700 |
| 2019 | $2,592 | $110,200 | $26,500 | $83,700 |
| 2018 | $2,009 | $92,000 | $22,800 | $69,200 |
| 2017 | $2,012 | $92,000 | $22,800 | $69,200 |
| 2016 | $2,634 | $92,000 | $22,800 | $69,200 |
| 2015 | $2,169 | $92,000 | $22,800 | $69,200 |
| 2014 | $2,645 | $92,000 | $22,800 | $69,200 |
| 2013 | $2,788 | $92,000 | $22,800 | $69,200 |
Source: Public Records
Map
Nearby Homes
- 625 Cleveland St
- 929 Gail Ave
- 631 Mckinley St
- 639 Mckinley St
- 870 Maple St
- 949 Higgins Ave
- 837 Betty Ave
- 708 Maple St
- 145 Langley Blvd
- 136 Langley Blvd Unit 138
- 618 Oak St
- 127 Spruce St
- 214 W Peckham St
- 856 Riverlawn St
- 964 Hickory Ln
- 122 Washington Ave
- 335 Washington Ave
- 401 Van St
- 419 S Church St
- 212 Harrison St