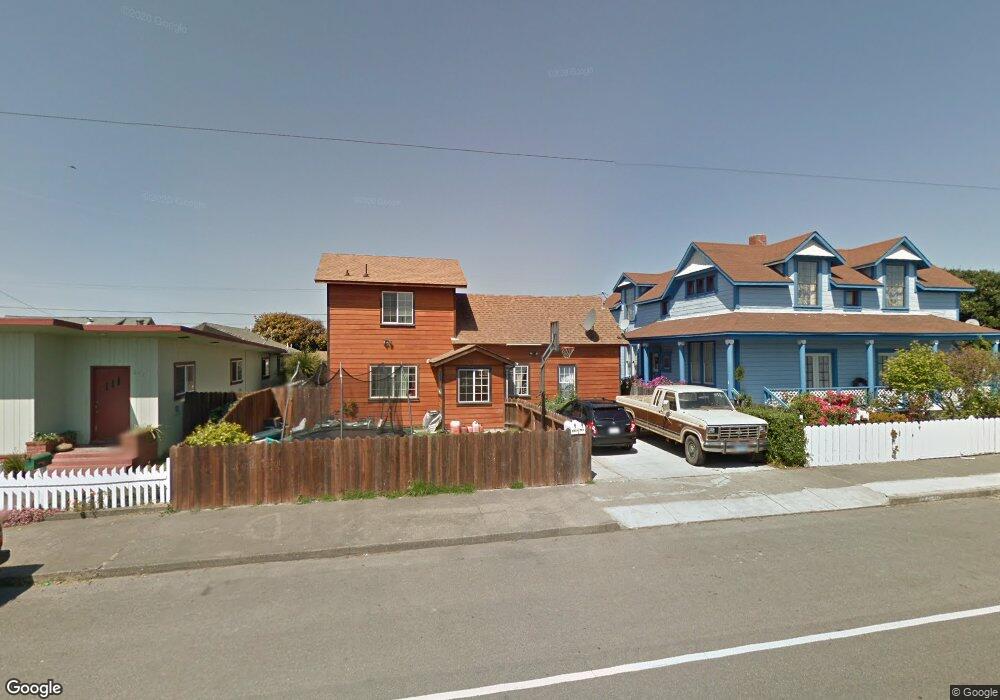
221 N Harrison St Fort Bragg, CA 95437
Estimated Value: $564,129 - $652,000
--
Bed
2
Baths
2,171
Sq Ft
$284/Sq Ft
Est. Value
About This Home
This home is located at 221 N Harrison St, Fort Bragg, CA 95437 and is currently estimated at $617,282, approximately $284 per square foot. 221 N Harrison St is a home located in Mendocino County with nearby schools including Fort Bragg High School and Three Rivers Charter School.
Ownership History
Date
Name
Owned For
Owner Type
Purchase Details
Closed on
Aug 8, 2024
Sold by
Davis Lyle and Davis Rodney Lyle
Bought by
R Lyle Davis Living Trust and Davis
Current Estimated Value
Purchase Details
Closed on
Jun 14, 2024
Sold by
Davis Lyle and Davis Rodney Lyle
Bought by
R Lyle Davis Living Trust and Davis
Purchase Details
Closed on
Jul 23, 2021
Sold by
Davis Rodney Lyle and Davis Lyle
Bought by
Aban Freddy T
Purchase Details
Closed on
Apr 8, 2021
Sold by
Guzman Aracely Perdomo
Bought by
Aban Freddy T
Purchase Details
Closed on
Feb 13, 2002
Sold by
Hunt Shirley A
Bought by
Davis R Lyle and Davis Yvonne L
Home Financials for this Owner
Home Financials are based on the most recent Mortgage that was taken out on this home.
Original Mortgage
$136,000
Interest Rate
7.13%
Mortgage Type
Purchase Money Mortgage
Create a Home Valuation Report for This Property
The Home Valuation Report is an in-depth analysis detailing your home's value as well as a comparison with similar homes in the area
Home Values in the Area
Average Home Value in this Area
Purchase History
| Date | Buyer | Sale Price | Title Company |
|---|---|---|---|
| R Lyle Davis Living Trust | -- | None Listed On Document | |
| R Lyle Davis Living Trust | -- | None Listed On Document | |
| Aban Freddy T | -- | None Available | |
| Aban Freddy T | -- | None Available | |
| Davis R Lyle | $160,000 | Redwood Empire Title Company |
Source: Public Records
Mortgage History
| Date | Status | Borrower | Loan Amount |
|---|---|---|---|
| Previous Owner | Davis R Lyle | $136,000 |
Source: Public Records
Tax History Compared to Growth
Tax History
| Year | Tax Paid | Tax Assessment Tax Assessment Total Assessment is a certain percentage of the fair market value that is determined by local assessors to be the total taxable value of land and additions on the property. | Land | Improvement |
|---|---|---|---|---|
| 2025 | $4,979 | $428,788 | $124,915 | $303,873 |
| 2023 | $4,979 | $412,139 | $120,065 | $292,074 |
| 2022 | $4,954 | $310,143 | $97,437 | $212,706 |
| 2021 | $3,623 | $304,063 | $95,527 | $208,536 |
| 2020 | $3,549 | $300,951 | $94,552 | $206,399 |
| 2019 | $3,503 | $295,050 | $92,698 | $202,352 |
| 2018 | $3,458 | $289,266 | $90,881 | $198,385 |
| 2017 | $3,235 | $283,596 | $89,100 | $194,496 |
| 2016 | $3,172 | $278,036 | $87,353 | $190,683 |
| 2015 | $3,122 | $273,861 | $86,041 | $187,820 |
| 2014 | $3,044 | $268,498 | $84,356 | $184,142 |
Source: Public Records
Map
Nearby Homes
- 142 S Franklin St
- 423 N Franklin St
- 251 S Franklin St
- 119 E Pine St
- 459 S Mcpherson St
- 494 S Whipple St
- 131 Halsey Way
- 715 West St
- 571 S Franklin St
- 575 S Whipple St
- 517 S Lincoln St
- 215 S Sanderson Way
- 944 Stewart St
- 924 Glass Beach Dr
- 854 Woodward St
- 300 N Harbor Dr
- 1184 N Main St Unit 1
- 19351 Del Mar Dr
- 19701 Noyo Acres Dr
- 19171 S Harbor Dr
- 227 N Harrison St
- 211 N Harrison St
- 325 E Alder St
- 203 N Harrison St
- 233 N Harrison St
- 220 N Mcpherson St
- 315 E Alder St
- 243 N Harrison St
- 228 N Mcpherson St
- 234 N Mcpherson St
- 200 N Mcpherson St
- 210 N Mcpherson St
- 232 N Harrison St
- 210 N Harrison St
- 234 N Harrison St
- 638 E Oak St
- 236 N Harrison St
- 407 E Alder St
- 322 E Redwood Ave
- 342 E Alder St