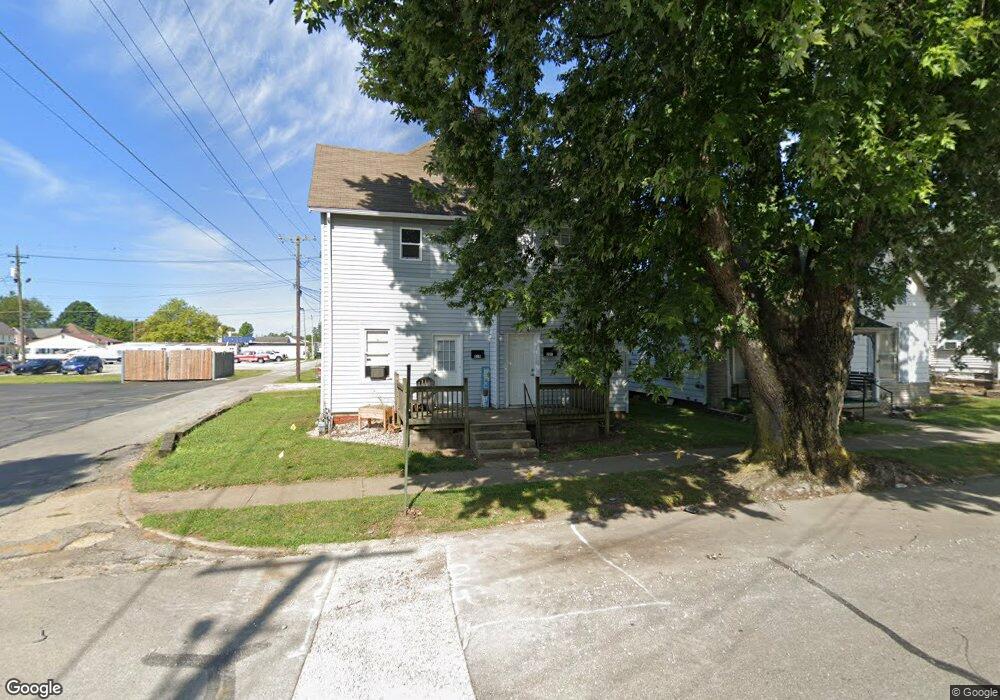
221 N Harrison St Rushville, IN 46173
Estimated Value: $95,000 - $245,000
1
Bed
2
Baths
2,364
Sq Ft
$62/Sq Ft
Est. Value
About This Home
This home is located at 221 N Harrison St, Rushville, IN 46173 and is currently estimated at $146,648, approximately $62 per square foot. 221 N Harrison St is a home located in Rush County with nearby schools including Rushville Consolidated High School and St. Mary Catholic School.
Ownership History
Date
Name
Owned For
Owner Type
Purchase Details
Closed on
Aug 15, 2023
Sold by
Trip Investment Properties Llc
Bought by
W2m Llc
Current Estimated Value
Home Financials for this Owner
Home Financials are based on the most recent Mortgage that was taken out on this home.
Original Mortgage
$77,440
Outstanding Balance
$73,321
Interest Rate
6.71%
Mortgage Type
New Conventional
Estimated Equity
$73,327
Purchase Details
Closed on
Mar 23, 2022
Sold by
Newton Tony J
Bought by
Trip Investment Properties Llc
Purchase Details
Closed on
Jul 5, 2019
Sold by
Sevier Phillip D
Bought by
Wooldridge Ronald L
Create a Home Valuation Report for This Property
The Home Valuation Report is an in-depth analysis detailing your home's value as well as a comparison with similar homes in the area
Home Values in the Area
Average Home Value in this Area
Purchase History
| Date | Buyer | Sale Price | Title Company |
|---|---|---|---|
| W2m Llc | $96,800 | Rush Title Services | |
| Trip Investment Properties Llc | -- | None Listed On Document | |
| Wooldridge Ronald L | -- | None Available |
Source: Public Records
Mortgage History
| Date | Status | Borrower | Loan Amount |
|---|---|---|---|
| Open | W2m Llc | $77,440 |
Source: Public Records
Tax History Compared to Growth
Tax History
| Year | Tax Paid | Tax Assessment Tax Assessment Total Assessment is a certain percentage of the fair market value that is determined by local assessors to be the total taxable value of land and additions on the property. | Land | Improvement |
|---|---|---|---|---|
| 2024 | $1,880 | $94,000 | $7,800 | $86,200 |
| 2023 | $1,756 | $87,800 | $7,800 | $80,000 |
| 2022 | $1,618 | $80,900 | $7,800 | $73,100 |
| 2021 | $1,490 | $74,500 | $7,800 | $66,700 |
| 2020 | $1,404 | $70,200 | $7,300 | $62,900 |
| 2019 | $1,328 | $66,400 | $7,300 | $59,100 |
| 2018 | $1,364 | $68,200 | $4,800 | $63,400 |
| 2017 | $1,344 | $67,200 | $4,800 | $62,400 |
| 2016 | $1,306 | $65,300 | $4,800 | $60,500 |
| 2014 | $1,342 | $67,100 | $4,800 | $62,300 |
| 2013 | $1,342 | $67,100 | $4,800 | $62,300 |
Source: Public Records
Map
Nearby Homes