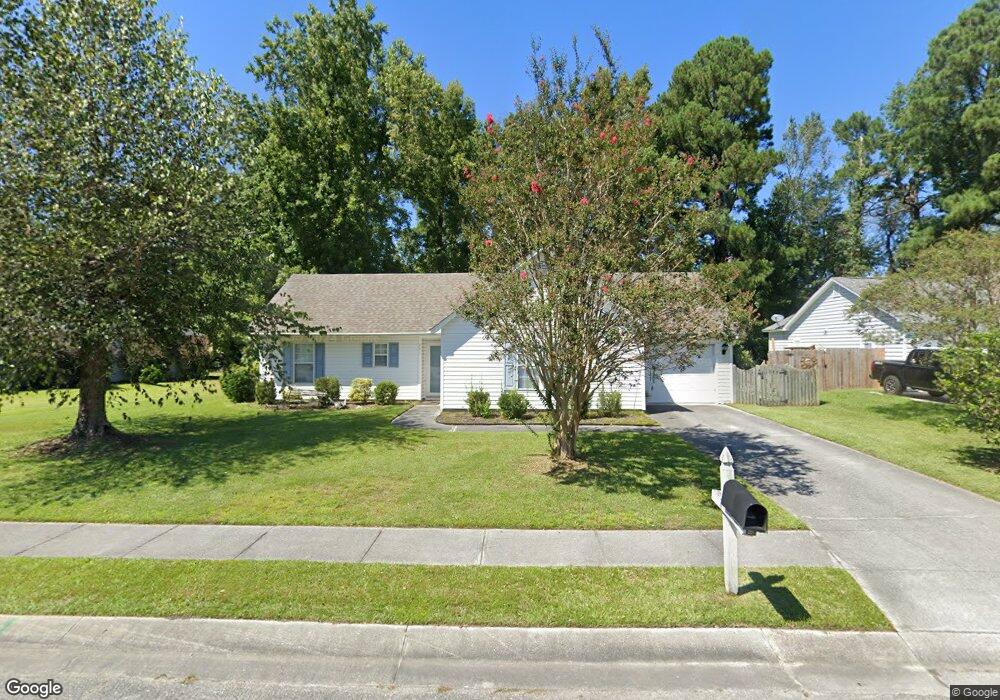
221 Olde Well Loop Rd Wilmington, NC 28411
Estimated Value: $323,959 - $346,000
3
Beds
2
Baths
1,209
Sq Ft
$277/Sq Ft
Est. Value
About This Home
This home is located at 221 Olde Well Loop Rd, Wilmington, NC 28411 and is currently estimated at $334,490, approximately $276 per square foot. 221 Olde Well Loop Rd is a home located in New Hanover County with nearby schools including John J. Blair Elementary School, Emma B. Trask Middle School, and Emsley A. Laney High School.
Ownership History
Date
Name
Owned For
Owner Type
Purchase Details
Closed on
Oct 27, 2017
Sold by
Gibson Gordon and Gibson Grace
Bought by
Ggibson Enterprises Llc
Current Estimated Value
Home Financials for this Owner
Home Financials are based on the most recent Mortgage that was taken out on this home.
Original Mortgage
$195,000
Interest Rate
3.78%
Mortgage Type
Commercial
Purchase Details
Closed on
Nov 14, 2014
Sold by
Gibson Barbara A and Gibson Gordan
Bought by
Gibson Barbara A and Gibson Gordan
Purchase Details
Closed on
Aug 6, 2014
Sold by
Gibson Barbara A
Bought by
Gibson Gordon
Purchase Details
Closed on
Dec 11, 1998
Sold by
Landmark Homes Inc
Bought by
Gibson Barbara A
Purchase Details
Closed on
Jun 24, 1998
Sold by
Farrington Farms Develop Corp
Bought by
Landmark Homes Inc
Purchase Details
Closed on
Nov 14, 1995
Sold by
Gts Development Llc
Bought by
Farrington Farms Develop Corp
Create a Home Valuation Report for This Property
The Home Valuation Report is an in-depth analysis detailing your home's value as well as a comparison with similar homes in the area
Home Values in the Area
Average Home Value in this Area
Purchase History
| Date | Buyer | Sale Price | Title Company |
|---|---|---|---|
| Ggibson Enterprises Llc | -- | None Available | |
| Gibson Barbara A | -- | None Available | |
| Gibson Gordon | $1,354 | None Available | |
| Gibson Barbara A | $112,500 | -- | |
| Landmark Homes Inc | $414,000 | -- | |
| Farrington Farms Develop Corp | -- | -- |
Source: Public Records
Mortgage History
| Date | Status | Borrower | Loan Amount |
|---|---|---|---|
| Closed | Ggibson Enterprises Llc | $195,000 |
Source: Public Records
Tax History Compared to Growth
Tax History
| Year | Tax Paid | Tax Assessment Tax Assessment Total Assessment is a certain percentage of the fair market value that is determined by local assessors to be the total taxable value of land and additions on the property. | Land | Improvement |
|---|---|---|---|---|
| 2025 | -- | $318,200 | $108,200 | $210,000 |
| 2024 | -- | $217,400 | $59,500 | $157,900 |
| 2023 | -- | $217,400 | $59,500 | $157,900 |
| 2022 | $0 | $216,400 | $59,500 | $156,900 |
| 2021 | $992 | $216,400 | $59,500 | $156,900 |
| 2020 | $992 | $156,900 | $44,000 | $112,900 |
| 2019 | $992 | $156,900 | $44,000 | $112,900 |
| 2018 | $992 | $156,900 | $44,000 | $112,900 |
| 2017 | $1,016 | $156,900 | $44,000 | $112,900 |
| 2016 | $938 | $135,400 | $42,000 | $93,400 |
| 2015 | $872 | $135,400 | $42,000 | $93,400 |
| 2014 | $857 | $135,400 | $42,000 | $93,400 |
Source: Public Records
Map
Nearby Homes
- 209 Olde Well Loop Rd
- 1911 Daniel Boone Trail
- 6331 Gordon Rd
- 1915 Daniel Boone Trail
- 1907 Daniel Boone Trail
- 6329 Gordon Rd
- 2213 White Rd
- 2232 White Rd
- 2607 Bradfield Ct
- 2400 Sunburst Ct
- 6110 Gordon Rd
- 2408 Sapling Cir
- 2415 Sapling Cir
- 802 Mayfield Ct
- 7108 Thurgood Rd
- 2305 Wildberry Ct
- 811 Bay Blossom Dr
- 2409 White Rd
- 2417 White Rd
- 2309 Sunnyside Dr
- 217 Olde Well Loop Rd
- 225 Olde Well Loop Rd
- 214 Olde Well Loop Rd
- 212 Olde Well Loop Rd
- 216 Olde Well Loop Rd
- 215 Olde Well Loop Rd
- 210 Olde Well Loop Rd
- 208 Olde Well Loop Rd
- 6606 Wheatfields Ct
- 208 Olde Well Loop Rd
- 227 Olde Well Loop Rd
- 213 Olde Well Loop Rd
- 6604 Wheatfields Ct Unit 43
- 6608 Wheatfields Ct
- 7119 Farrington Farms Dr
- 7117 Farrington Farms Dr
- 6610 Wheatfields Ct
- 6907 Myric Ct
- 6905 Myric Ct
- 6612 Wheatfields Ct