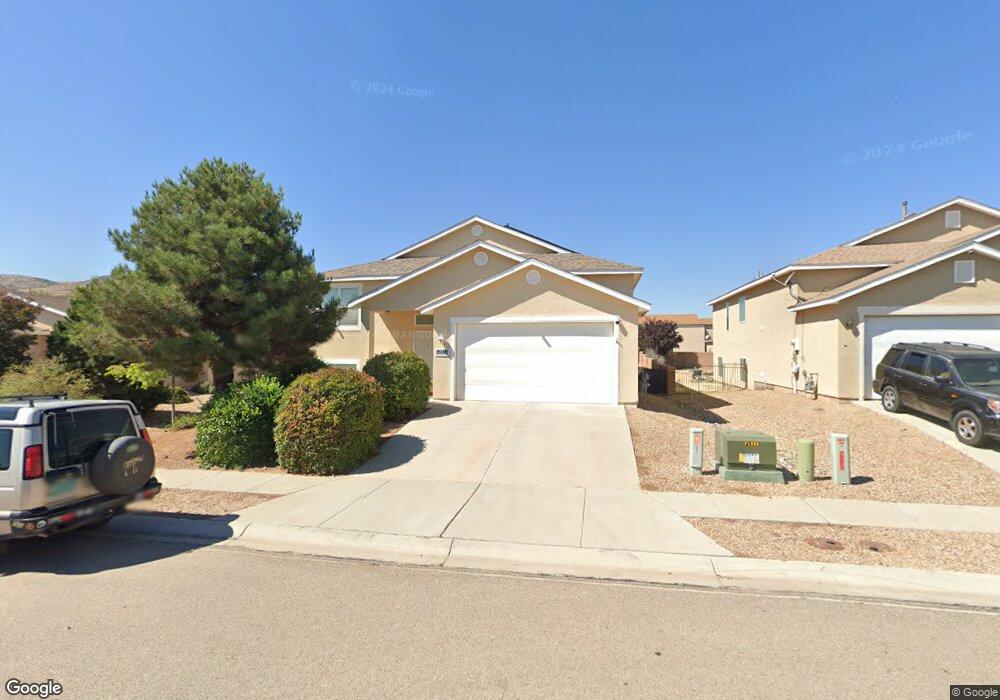
221 Open Range Ave SW Los Lunas, NM 87031
West Los Lunas NeighborhoodEstimated Value: $346,000 - $378,000
4
Beds
3
Baths
2,695
Sq Ft
$135/Sq Ft
Est. Value
About This Home
This home is located at 221 Open Range Ave SW, Los Lunas, NM 87031 and is currently estimated at $363,038, approximately $134 per square foot. 221 Open Range Ave SW is a home located in Valencia County with nearby schools including Sundance Elementary School, Los Lunas Middle School, and Los Lunas High School.
Ownership History
Date
Name
Owned For
Owner Type
Purchase Details
Closed on
Oct 19, 2011
Sold by
Bank Of New York Mellon
Bought by
Mullis James C and Mullis Sharon M
Current Estimated Value
Purchase Details
Closed on
May 25, 2010
Sold by
Griego Charles
Bought by
Bac Home Loans Servicing Lp
Purchase Details
Closed on
Mar 10, 2006
Sold by
Artistic Homes Inc
Bought by
Banda Robert
Home Financials for this Owner
Home Financials are based on the most recent Mortgage that was taken out on this home.
Original Mortgage
$172,752
Interest Rate
6.09%
Mortgage Type
New Conventional
Purchase Details
Closed on
Feb 8, 2006
Sold by
Curb South Llc
Bought by
Artistic Homes Inc
Home Financials for this Owner
Home Financials are based on the most recent Mortgage that was taken out on this home.
Original Mortgage
$172,752
Interest Rate
6.09%
Mortgage Type
New Conventional
Create a Home Valuation Report for This Property
The Home Valuation Report is an in-depth analysis detailing your home's value as well as a comparison with similar homes in the area
Home Values in the Area
Average Home Value in this Area
Purchase History
| Date | Buyer | Sale Price | Title Company |
|---|---|---|---|
| Mullis James C | -- | -- | |
| Bac Home Loans Servicing Lp | $145,800 | -- | |
| Banda Robert | -- | None Available | |
| Artistic Homes Inc | -- | None Available |
Source: Public Records
Mortgage History
| Date | Status | Borrower | Loan Amount |
|---|---|---|---|
| Previous Owner | Banda Robert | $172,752 |
Source: Public Records
Tax History Compared to Growth
Tax History
| Year | Tax Paid | Tax Assessment Tax Assessment Total Assessment is a certain percentage of the fair market value that is determined by local assessors to be the total taxable value of land and additions on the property. | Land | Improvement |
|---|---|---|---|---|
| 2025 | $2,726 | $81,567 | $12,278 | $69,289 |
| 2024 | $2,425 | $79,191 | $11,661 | $67,530 |
| 2023 | $2,333 | $76,885 | $11,063 | $65,822 |
| 2022 | $2,289 | $74,645 | $10,482 | $64,163 |
| 2021 | $2,237 | $72,471 | $10,796 | $61,675 |
| 2020 | $2,208 | $70,360 | $10,482 | $59,878 |
| 2019 | $2,220 | $70,360 | $10,482 | $59,878 |
| 2018 | $2,181 | $70,360 | $10,482 | $59,878 |
| 2017 | $2,217 | $68,445 | $10,482 | $57,963 |
| 2016 | $2,153 | $66,452 | $10,482 | $55,970 |
| 2015 | -- | $64,516 | $10,482 | $54,034 |
| 2013 | -- | $60,813 | $10,482 | $50,331 |
| 2011 | -- | $177,126 | $30,531 | $146,595 |
Source: Public Records
Map
Nearby Homes
- 191 Open Range Ave SW
- 3461 Lonetree St SW
- 241 Big Sky Ave SW
- 680 Purple Aster Ave SW
- 2981 Desert Sage Ave SW
- 750 Creekside Ave SW
- 3787 Tayrien Ct SW
- 3700 Santa fe Trail SW
- 3640 Santa fe Trail SW
- 471 Chafey Dr SW
- 3291 Prairie Sage St SW
- 3271 Prairie Ridge St SW
- 3580 Santa fe Trail SW
- Sandia Plan at The Trails at El Cerro
- Bandera Plan at The Trails at El Cerro
- Manzano Plan at The Trails at El Cerro
- Alameda Plan at The Trails at El Cerro
- 3601 Santa fe Trail SW
- 460 Rio Chama Cir SW
- 440 Rio Chama Cir SW
- 231 Open Range Ave SW
- 231 Open Range Ave SW Unit 1
- 211 Open Range Ave SW
- 3141 Wagon Wheel St SW
- 3131 Wagon Wheel St SW
- 251 Open Range Ave SW
- 201 Open Range Ave SW
- 3111 Wagon Wheel St SW
- 3151 Wagon Wheel St SW
- 130 Black Hat Ave SW
- 3101 Wagon Wheel St SW
- 271 Open Range Ave SW
- 3171 Wagon Wheel St SW
- 3091 Wagon Wheel St SW
- 3191 Wagon Wheel St SW
- 140 Black Hat Ave SW
- 291 Open Range Ave SW
- 291 Open Range Ave SW Unit 1
- 270 Open Range Ave SW
- 200 Open Range Ave SW