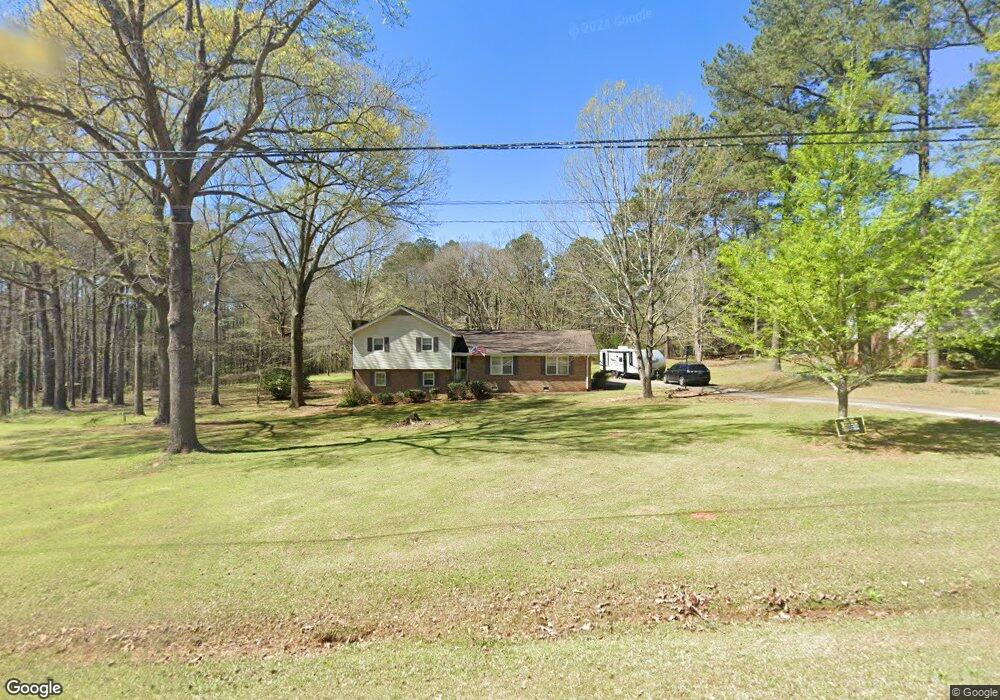
221 Pinehaven Dr Lagrange, GA 30240
Estimated Value: $224,735 - $281,000
4
Beds
3
Baths
1,410
Sq Ft
$172/Sq Ft
Est. Value
About This Home
This home is located at 221 Pinehaven Dr, Lagrange, GA 30240 and is currently estimated at $243,184, approximately $172 per square foot. 221 Pinehaven Dr is a home located in Troup County with nearby schools including Ethel W. Kight Elementary School, Hollis Hand Elementary School, and Franklin Forest Elementary School.
Ownership History
Date
Name
Owned For
Owner Type
Purchase Details
Closed on
Apr 24, 2020
Sold by
Cox Bobby L
Bought by
Highland Deborah A
Current Estimated Value
Home Financials for this Owner
Home Financials are based on the most recent Mortgage that was taken out on this home.
Original Mortgage
$137,365
Outstanding Balance
$120,531
Interest Rate
3.25%
Mortgage Type
FHA
Estimated Equity
$122,653
Purchase Details
Closed on
May 25, 2018
Sold by
Earley Shirley J
Bought by
Cox Gregory T and Cox Bobby L
Home Financials for this Owner
Home Financials are based on the most recent Mortgage that was taken out on this home.
Original Mortgage
$84,480
Interest Rate
4.99%
Mortgage Type
New Conventional
Purchase Details
Closed on
Aug 17, 1978
Sold by
King Q P
Bought by
Earley Paul Wilkie
Purchase Details
Closed on
Mar 7, 1978
Sold by
Glen Thurman
Bought by
King Q P
Purchase Details
Closed on
Oct 21, 1976
Bought by
Glen Thurman
Create a Home Valuation Report for This Property
The Home Valuation Report is an in-depth analysis detailing your home's value as well as a comparison with similar homes in the area
Purchase History
| Date | Buyer | Sale Price | Title Company |
|---|---|---|---|
| Highland Deborah A | $139,900 | -- | |
| Cox Gregory T | $105,600 | -- | |
| Earley Paul Wilkie | $48,500 | -- | |
| King Q P | $5,000 | -- | |
| Glen Thurman | -- | -- |
Source: Public Records
Mortgage History
| Date | Status | Borrower | Loan Amount |
|---|---|---|---|
| Open | Highland Deborah A | $137,365 | |
| Previous Owner | Cox Gregory T | $84,480 |
Source: Public Records
Tax History
| Year | Tax Paid | Tax Assessment Tax Assessment Total Assessment is a certain percentage of the fair market value that is determined by local assessors to be the total taxable value of land and additions on the property. | Land | Improvement |
|---|---|---|---|---|
| 2025 | $2,067 | $75,788 | $12,000 | $63,788 |
| 2024 | $1,902 | $69,748 | $12,000 | $57,748 |
| 2023 | $1,813 | $66,468 | $12,000 | $54,468 |
| 2022 | $1,802 | $64,548 | $12,000 | $52,548 |
| 2021 | $1,641 | $54,400 | $9,000 | $45,400 |
| 2020 | $1,581 | $54,400 | $9,000 | $45,400 |
| 2019 | $1,214 | $43,220 | $9,000 | $34,220 |
| 2018 | $1,153 | $40,220 | $6,000 | $34,220 |
| 2017 | $1,153 | $40,220 | $6,000 | $34,220 |
| 2016 | $1,137 | $39,673 | $6,000 | $33,673 |
| 2015 | $1,139 | $39,673 | $6,000 | $33,673 |
| 2014 | $1,087 | $37,901 | $6,000 | $31,901 |
| 2013 | -- | $39,417 | $6,000 | $33,417 |
Source: Public Records
Map
Nearby Homes
- 223 Pinehaven Dr
- 117 Brookwood Dr
- 336 Whitaker Rd
- 104 Spring Valley Dr
- 641 Whitaker Rd
- 200 Cheyenne Dr
- 203 Shawnee Dr
- 3 Reed Dr
- 217 Highland Trail
- 214 Willowcrest Way
- 0 Unit 10514554
- 960 Cameron Mill Rd
- 1000 Foxcroft Dr
- 427 Fling Rd
- 509 Connie Dr
- 8 Horace Carter Rd
- 638 Cameron Mill Rd
- 101 Deal Dr
- 102 Millridge Dr
- 0 Bradfield Dr Unit 10568803
- 217 Pinehaven Dr
- 220 Pinehaven Dr
- 222 Pinehaven Dr
- 216 Pinehaven Dr
- 215 Pinehaven Dr
- 214 Pinehaven Dr
- 212 Pinehaven Dr
- 210 Pinehaven Dr
- 213 Pinehaven Dr
- 213 Pinehaven Dr Unit 1
- 208 Pinehaven Dr Unit 20
- 208 Pinehaven Dr
- 211 Pinehaven Dr
- 206 Pinehaven Dr
- 209 Pinehaven Dr
- 204 Pinehaven Dr
- 207 Pinehaven Dr
- 202 Pinehaven Dr
- 205 Pinehaven Dr
- 200 Pinehaven Dr
Your Personal Tour Guide
Ask me questions while you tour the home.