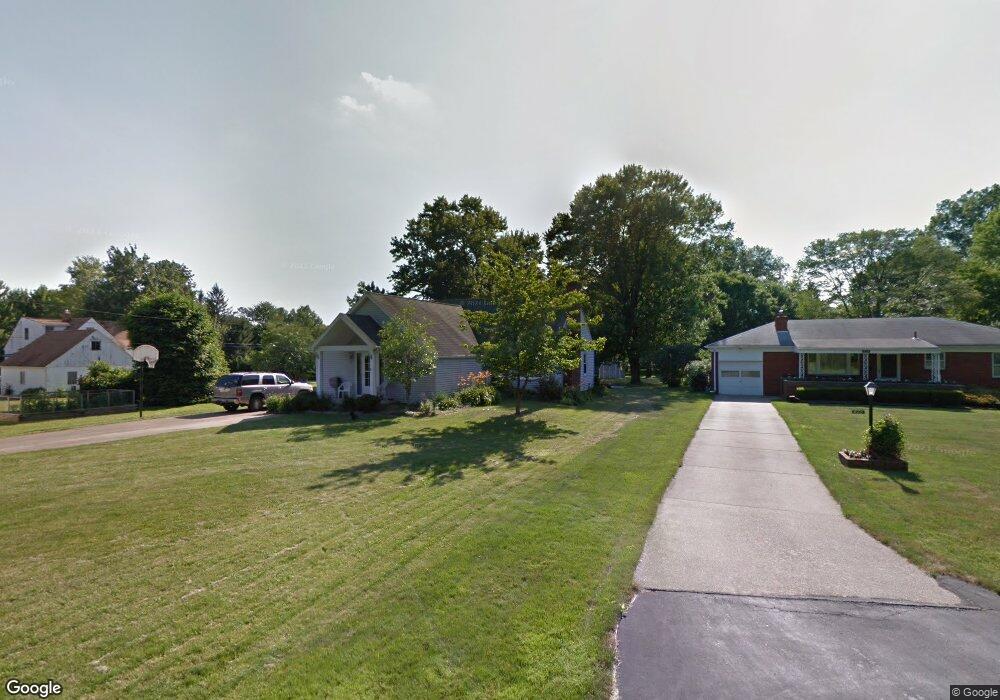
221 Sheridan Rd Youngstown, OH 44514
Estimated Value: $264,000 - $319,000
4
Beds
3
Baths
2,816
Sq Ft
$104/Sq Ft
Est. Value
About This Home
This home is located at 221 Sheridan Rd, Youngstown, OH 44514 and is currently estimated at $291,870, approximately $103 per square foot. 221 Sheridan Rd is a home located in Mahoning County with nearby schools including Poland Union Elementary School, Poland Middle School, and Poland Seminary High School.
Ownership History
Date
Name
Owned For
Owner Type
Purchase Details
Closed on
Jul 23, 2012
Sold by
Orr William J and Orr Sarah
Bought by
Sutton Edward R
Current Estimated Value
Home Financials for this Owner
Home Financials are based on the most recent Mortgage that was taken out on this home.
Original Mortgage
$85,769
Outstanding Balance
$59,429
Interest Rate
3.75%
Mortgage Type
FHA
Estimated Equity
$232,441
Purchase Details
Closed on
Feb 2, 2012
Sold by
Capan Mark A and Capan Lisa M
Bought by
Orr William J
Purchase Details
Closed on
Oct 19, 1994
Sold by
Satterfield Jeffrey L
Bought by
Capan Mark A and Capan Lisa M
Home Financials for this Owner
Home Financials are based on the most recent Mortgage that was taken out on this home.
Original Mortgage
$71,900
Interest Rate
7%
Mortgage Type
New Conventional
Purchase Details
Closed on
Oct 21, 1991
Bought by
Satterfield Jeffrey L and Satterfield K
Create a Home Valuation Report for This Property
The Home Valuation Report is an in-depth analysis detailing your home's value as well as a comparison with similar homes in the area
Home Values in the Area
Average Home Value in this Area
Purchase History
| Date | Buyer | Sale Price | Title Company |
|---|---|---|---|
| Sutton Edward R | $88,000 | Attorney | |
| Orr William J | $60,100 | None Available | |
| Capan Mark A | $79,900 | -- | |
| Satterfield Jeffrey L | $42,000 | -- |
Source: Public Records
Mortgage History
| Date | Status | Borrower | Loan Amount |
|---|---|---|---|
| Open | Sutton Edward R | $85,769 | |
| Previous Owner | Capan Mark A | $71,900 |
Source: Public Records
Tax History Compared to Growth
Tax History
| Year | Tax Paid | Tax Assessment Tax Assessment Total Assessment is a certain percentage of the fair market value that is determined by local assessors to be the total taxable value of land and additions on the property. | Land | Improvement |
|---|---|---|---|---|
| 2024 | $4,014 | $72,970 | $11,010 | $61,960 |
| 2023 | $3,929 | $72,230 | $11,010 | $61,220 |
| 2022 | $3,790 | $61,080 | $7,910 | $53,170 |
| 2021 | $3,896 | $59,440 | $7,910 | $51,530 |
| 2020 | $2,884 | $48,330 | $7,910 | $40,420 |
| 2019 | $2,126 | $33,050 | $7,910 | $25,140 |
| 2018 | $2,063 | $33,050 | $7,910 | $25,140 |
| 2017 | $2,117 | $33,050 | $7,910 | $25,140 |
| 2016 | $2,174 | $33,190 | $7,160 | $26,030 |
| 2015 | $2,067 | $33,190 | $7,160 | $26,030 |
| 2014 | $2,074 | $33,190 | $7,160 | $26,030 |
| 2013 | $1,993 | $33,190 | $7,160 | $26,030 |
Source: Public Records
Map
Nearby Homes
- 1827 Alverne Dr
- 1804 Alverne Dr
- 1738 Island Dr
- 43 Venloe Dr
- 2035 Woodward Ave
- 34 Venloe Dr
- 1894 Lealand Ave
- 1859 Mathews Rd
- 1890 Mathews Rd
- 2295 Bel Aire Ln
- 1 Michigan Ave
- 0 Mathews Rd Unit 5149232
- 0 Mathews Rd Unit 5143059
- 2379 Clyde St
- 2153 Lyon Blvd
- 2128 Lyon Blvd
- 2307 Hamilton Ave
- 5710 Youngstown Poland Rd
- 0 Oles Ave
- 8360 South Ave
- 225 Sheridan Rd
- 112 Delaware Ave
- 229 Sheridan Rd
- 116 Delaware Ave
- 108 Delaware Ave
- 104 Delaware Ave
- 233 Sheridan Rd
- 120 Delaware Ave
- 103 Island Dr
- 45 Island Dr
- 113 Island Dr
- 1888 Delaware Ave
- 1886 Delaware Ave Unit 888
- 0 Delaware Ave
- 43 Island Dr
- 237 Sheridan Rd
- 113 Delaware Ave
- 111 Delaware Ave
- 52 Delaware Ave
- 119 Island Dr