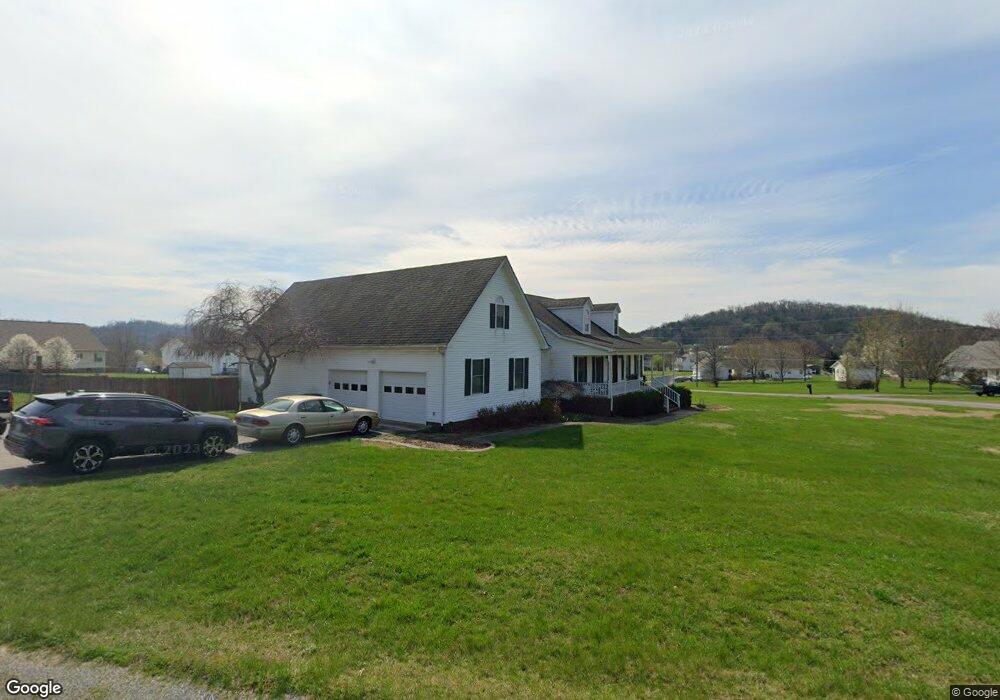
221 Skyview Rd Bell Buckle, TN 37020
Estimated Value: $494,013 - $768,000
--
Bed
3
Baths
3,104
Sq Ft
$188/Sq Ft
Est. Value
About This Home
This home is located at 221 Skyview Rd, Bell Buckle, TN 37020 and is currently estimated at $584,753, approximately $188 per square foot. 221 Skyview Rd is a home located in Bedford County with nearby schools including Cascade Elementary School, Cascade Middle School, and Cascade High School.
Ownership History
Date
Name
Owned For
Owner Type
Purchase Details
Closed on
Mar 31, 2025
Sold by
Mead David N and Mead Terilyn B
Bought by
David N Mead & Terilyn B Mead Tenants By The and Mead
Current Estimated Value
Purchase Details
Closed on
Jun 14, 2013
Sold by
White Jessica L
Bought by
Mead David N and Mead Terilyn B
Purchase Details
Closed on
Mar 31, 2010
Sold by
Phillips Darryl E
Bought by
White Jessica L
Purchase Details
Closed on
Sep 24, 2001
Sold by
Hawkins Builders
Bought by
Phillips Darryl E and Phillips Donna
Home Financials for this Owner
Home Financials are based on the most recent Mortgage that was taken out on this home.
Original Mortgage
$175,765
Interest Rate
9.75%
Purchase Details
Closed on
May 18, 2001
Bought by
Hawkins Venson & Faye D/B/A Hawkins Builder
Create a Home Valuation Report for This Property
The Home Valuation Report is an in-depth analysis detailing your home's value as well as a comparison with similar homes in the area
Home Values in the Area
Average Home Value in this Area
Purchase History
| Date | Buyer | Sale Price | Title Company |
|---|---|---|---|
| David N Mead & Terilyn B Mead Tenants By The | -- | None Listed On Document | |
| David N Mead & Terilyn B Mead Tenants By The | -- | None Listed On Document | |
| Mead David N | $213,000 | -- | |
| White Jessica L | $210,000 | -- | |
| Phillips Darryl E | $175,765 | -- | |
| Hawkins Venson & Faye D/B/A Hawkins Builder | $12,000 | -- |
Source: Public Records
Mortgage History
| Date | Status | Borrower | Loan Amount |
|---|---|---|---|
| Previous Owner | Hawkins Venson & Faye D/B/A Hawkins Builder | $175,765 |
Source: Public Records
Tax History Compared to Growth
Tax History
| Year | Tax Paid | Tax Assessment Tax Assessment Total Assessment is a certain percentage of the fair market value that is determined by local assessors to be the total taxable value of land and additions on the property. | Land | Improvement |
|---|---|---|---|---|
| 2024 | $1,961 | $84,325 | $8,500 | $75,825 |
| 2023 | $1,961 | $84,325 | $8,500 | $75,825 |
| 2022 | $1,961 | $84,325 | $8,500 | $75,825 |
| 2021 | $1,657 | $84,325 | $8,500 | $75,825 |
| 2020 | $1,533 | $84,325 | $8,500 | $75,825 |
| 2019 | $1,533 | $57,650 | $6,250 | $51,400 |
| 2018 | $1,476 | $57,650 | $6,250 | $51,400 |
| 2017 | $1,476 | $57,650 | $6,250 | $51,400 |
| 2016 | $1,453 | $57,650 | $6,250 | $51,400 |
| 2015 | $1,453 | $57,650 | $6,250 | $51,400 |
| 2014 | $1,190 | $52,412 | $0 | $0 |
Source: Public Records
Map
Nearby Homes
- 286 Emily Ln
- 0 Happy Valley Rd
- 199 Gilmore Ln
- 0 Johnson Place Unit RTC2990038
- 0 Johnson Place Unit RTC2990036
- 0 Johnson Ln
- 305 Liberty Pike
- 201 Cumberland St
- 10B Puncheon Camp Ln
- 10A Puncheon Camp Ln
- 101 Webb Rd E
- 2640 Highway 82 E
- 0 Webb Rd
- 289 5th St
- 405 Webb Rd W
- 109 Autumn Ln
- 345 Dye Rd
- 108 Nestledown Crossing
- 264 Puncheon Camp Rd
- 120 Coop Rd
- 217 Vince Rd
- 201 Skyview Rd
- 210 Skyview Rd
- 221 Vince Rd
- 119 Mountain View Rd
- 206 Skyview Rd
- 225 Vince Rd
- 210 Vince Rd
- 117 Mountain View Rd
- 202 Skyview Rd
- 213 Vince Rd
- 229 Vince Rd
- 102 Matt Dr
- 115 Mountain View Rd
- 114 Skyview Rd
- 113 Skyview Rd
- 104 Matt Dr
- 206 Vince Rd
- 113 Mountain View Rd
- 118 Mountain View Rd