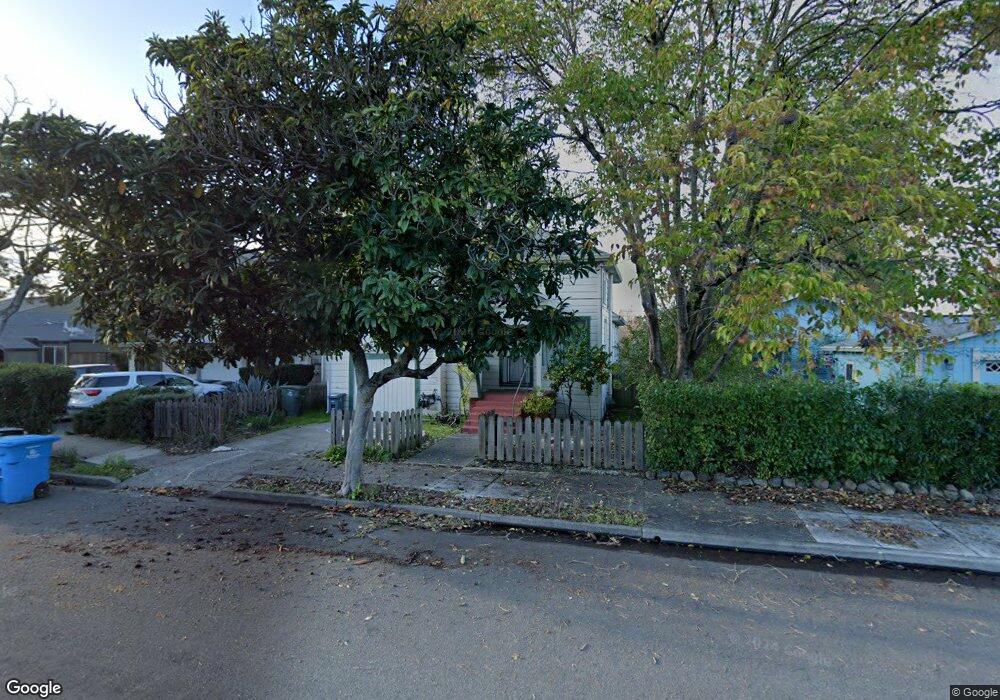
221 W 6th St Santa Rosa, CA 95401
Historic Railroad Square NeighborhoodEstimated Value: $519,000 - $555,000
2
Beds
2
Baths
1,329
Sq Ft
$405/Sq Ft
Est. Value
About This Home
This home is located at 221 W 6th St, Santa Rosa, CA 95401 and is currently estimated at $537,785, approximately $404 per square foot. 221 W 6th St is a home located in Sonoma County with nearby schools including Abraham Lincoln Elementary School, Santa Rosa Middle School, and Santa Rosa High School.
Ownership History
Date
Name
Owned For
Owner Type
Purchase Details
Closed on
Oct 17, 2003
Sold by
Binkley Donald G
Bought by
Binkley Donald G
Current Estimated Value
Home Financials for this Owner
Home Financials are based on the most recent Mortgage that was taken out on this home.
Original Mortgage
$87,000
Interest Rate
6.4%
Mortgage Type
Purchase Money Mortgage
Create a Home Valuation Report for This Property
The Home Valuation Report is an in-depth analysis detailing your home's value as well as a comparison with similar homes in the area
Home Values in the Area
Average Home Value in this Area
Purchase History
| Date | Buyer | Sale Price | Title Company |
|---|---|---|---|
| Binkley Donald G | -- | Chicago Title Co |
Source: Public Records
Mortgage History
| Date | Status | Borrower | Loan Amount |
|---|---|---|---|
| Closed | Binkley Donald G | $87,000 | |
| Closed | Binkley Donald G | $102,000 |
Source: Public Records
Tax History Compared to Growth
Tax History
| Year | Tax Paid | Tax Assessment Tax Assessment Total Assessment is a certain percentage of the fair market value that is determined by local assessors to be the total taxable value of land and additions on the property. | Land | Improvement |
|---|---|---|---|---|
| 2025 | $1,870 | $163,001 | $74,177 | $88,824 |
| 2024 | $1,870 | $159,806 | $72,723 | $87,083 |
| 2023 | $1,870 | $156,674 | $71,298 | $85,376 |
| 2022 | $1,729 | $153,602 | $69,900 | $83,702 |
| 2021 | $1,708 | $150,591 | $68,530 | $82,061 |
| 2020 | $1,704 | $149,048 | $67,828 | $81,220 |
| 2019 | $1,695 | $146,127 | $66,499 | $79,628 |
| 2018 | $1,685 | $143,263 | $65,196 | $78,067 |
| 2017 | $1,656 | $140,455 | $63,918 | $76,537 |
| 2016 | $1,635 | $137,702 | $62,665 | $75,037 |
| 2015 | $1,587 | $135,634 | $61,724 | $73,910 |
| 2014 | $1,490 | $132,978 | $60,515 | $72,463 |
Source: Public Records
Map
Nearby Homes