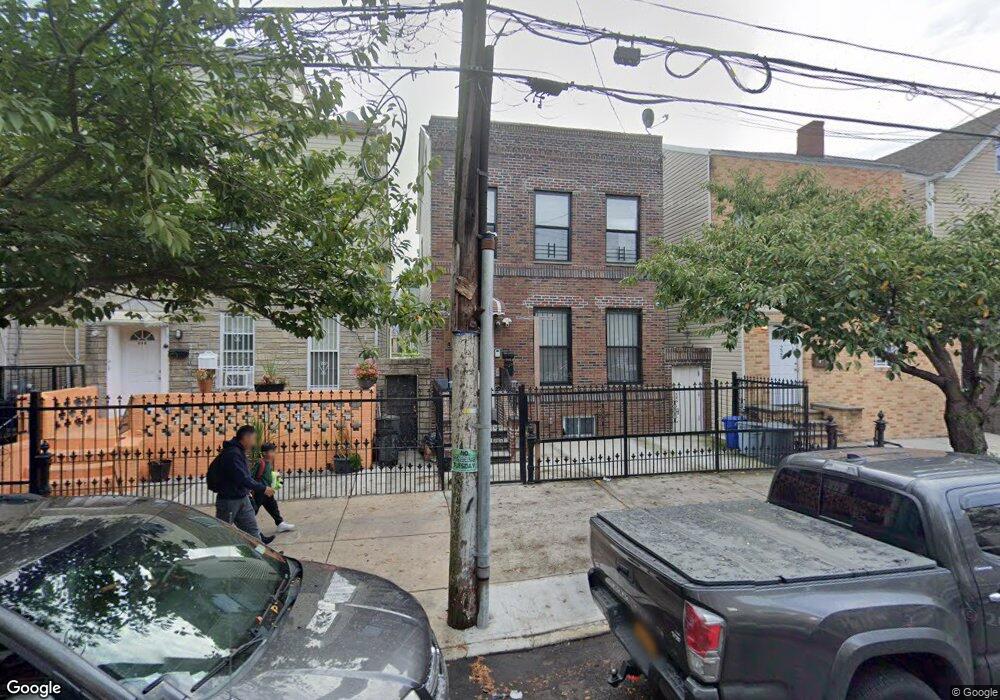
221 Warwick St Brooklyn, NY 11207
Cypress Hills NeighborhoodEstimated Value: $903,000 - $989,000
5
Beds
2
Baths
2,060
Sq Ft
$462/Sq Ft
Est. Value
About This Home
This home is located at 221 Warwick St, Brooklyn, NY 11207 and is currently estimated at $951,600, approximately $461 per square foot. 221 Warwick St is a home located in Kings County with nearby schools including P.S. 108 - Sal Abbracciamento, Vista Academy, and Liberty Avenue Middle School.
Ownership History
Date
Name
Owned For
Owner Type
Purchase Details
Closed on
May 30, 2018
Sold by
Mahamgu Naresh and Urbanowicz Surojh
Bought by
Freire Segundo G
Current Estimated Value
Home Financials for this Owner
Home Financials are based on the most recent Mortgage that was taken out on this home.
Original Mortgage
$460,000
Outstanding Balance
$396,142
Interest Rate
4.5%
Mortgage Type
New Conventional
Estimated Equity
$555,458
Purchase Details
Closed on
Feb 17, 2018
Sold by
Estate Of Kriparam Mahangu and Mahangu Naresh K
Bought by
Mahangu Naresh K and Urbanowicz Surojh
Purchase Details
Closed on
Jun 10, 2005
Sold by
Balgobin Subaschandra and Mahangu Kriparam
Bought by
Mahangu Kriparam
Purchase Details
Closed on
Mar 31, 2001
Sold by
Panaram Evelyn and Mahangu Kriparam
Bought by
Mahangu Kriparam and Balgobin Subaschandra
Create a Home Valuation Report for This Property
The Home Valuation Report is an in-depth analysis detailing your home's value as well as a comparison with similar homes in the area
Home Values in the Area
Average Home Value in this Area
Purchase History
| Date | Buyer | Sale Price | Title Company |
|---|---|---|---|
| Freire Segundo G | $575,000 | -- | |
| Freire Segundo G | $575,000 | -- | |
| Freire Segundo G | $575,000 | -- | |
| Mahangu Naresh K | -- | -- | |
| Mahangu Naresh K | -- | -- | |
| Mahangu Naresh K | -- | -- | |
| Mahangu Kriparam | -- | -- | |
| Mahangu Kriparam | -- | -- | |
| Mahangu Kriparam | $31,000 | Commonwealth Land Title Ins | |
| Mahangu Kriparam | -- | Commonwealth Land Title Ins |
Source: Public Records
Mortgage History
| Date | Status | Borrower | Loan Amount |
|---|---|---|---|
| Open | Freire Segundo G | $460,000 | |
| Closed | Freire Segundo G | $460,000 |
Source: Public Records
Tax History Compared to Growth
Tax History
| Year | Tax Paid | Tax Assessment Tax Assessment Total Assessment is a certain percentage of the fair market value that is determined by local assessors to be the total taxable value of land and additions on the property. | Land | Improvement |
|---|---|---|---|---|
| 2025 | $6,948 | $74,580 | $12,240 | $62,340 |
| 2024 | $6,948 | $71,280 | $12,240 | $59,040 |
| 2023 | $5,312 | $64,920 | $12,240 | $52,680 |
| 2022 | $4,928 | $52,620 | $12,240 | $40,380 |
| 2021 | $4,901 | $44,340 | $12,240 | $32,100 |
| 2020 | $2,436 | $44,880 | $12,240 | $32,640 |
| 2019 | $4,828 | $41,280 | $12,240 | $29,040 |
| 2018 | $4,443 | $21,795 | $8,787 | $13,008 |
| 2017 | $3,894 | $20,571 | $8,244 | $12,327 |
| 2016 | $3,570 | $19,407 | $7,628 | $11,779 |
| 2015 | $2,121 | $19,407 | $5,855 | $13,552 |
| 2014 | $2,121 | $19,233 | $5,954 | $13,279 |
Source: Public Records
Map
Nearby Homes
- 2880 Fulton St
- 126 Jerome St
- 221 Barbey St
- 168 Warwick St
- 87 Schenck Ave
- 2830 Fulton St
- 171 Arlington Ave
- 206 Elton St
- 153 Hendrix St
- 253 Ashford St
- 599 Liberty Ave
- 597 Liberty Ave
- 33 Jerome St
- 202 Schenck Ave
- 2825 Atlantic Ave
- 278 Ashford St
- 323 Barbey St
- 295 Ashford St
- 52 van Siclen Ave
- 48 van Siclen Ave
- 219 Warwick St
- 227 Warwick St
- 213 Warwick St
- 231 Warwick St
- 164 Ashford St
- 233 Warwick St
- 211 Warwick St
- 168 Ashford St
- 162 Ashford St
- 170 Ashford St
- 158 Ashford St
- 156 Ashford St
- 174 Ashford St
- 174 Ashford St Unit 2
- 237 Warwick St
- 207 Warwick St
- 2920 Fulton St
- 176 Ashford St
- 154 Ashford St
- 239 Warwick St