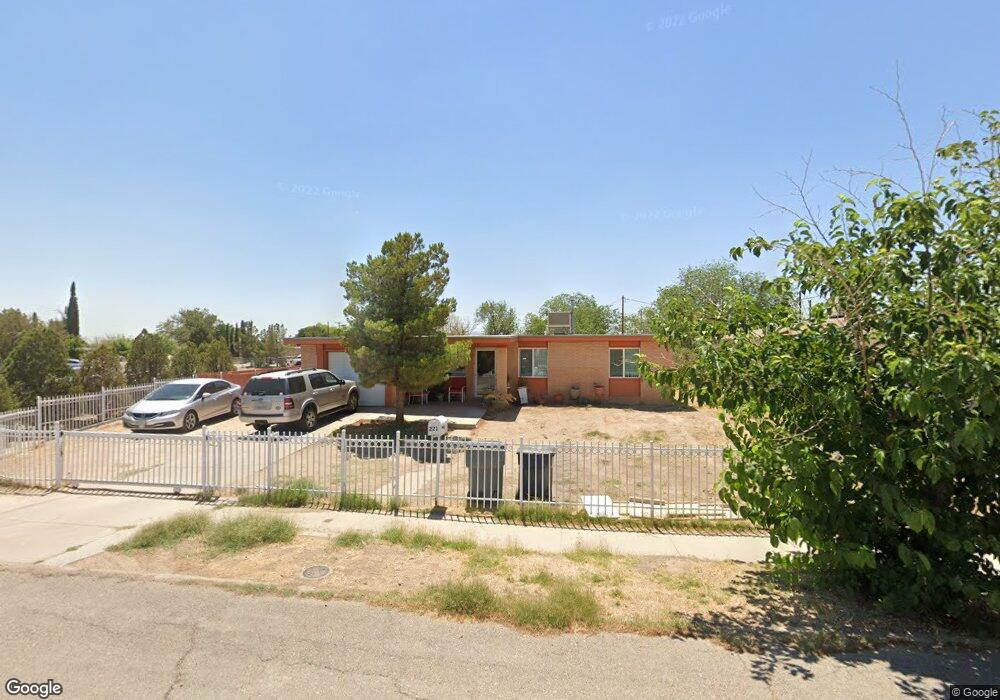
221 Yolanda Dr El Paso, TX 79915
Thomas Manor NeighborhoodEstimated Value: $154,000 - $173,447
3
Beds
2
Baths
1,108
Sq Ft
$148/Sq Ft
Est. Value
About This Home
This home is located at 221 Yolanda Dr, El Paso, TX 79915 and is currently estimated at $163,862, approximately $147 per square foot. 221 Yolanda Dr is a home located in El Paso County with nearby schools including Thomas Manor, Riverside Middle School, and Riverside High School.
Ownership History
Date
Name
Owned For
Owner Type
Purchase Details
Closed on
Apr 28, 2004
Sold by
Apodaca Hortensia and Apodaca Haydee Hortensia
Bought by
Carrera Ramon and Carrera Socorro
Current Estimated Value
Home Financials for this Owner
Home Financials are based on the most recent Mortgage that was taken out on this home.
Original Mortgage
$48,720
Outstanding Balance
$22,650
Interest Rate
5.38%
Mortgage Type
FHA
Estimated Equity
$141,212
Purchase Details
Closed on
Oct 8, 1997
Sold by
Hud
Bought by
Apodaca Juan
Home Financials for this Owner
Home Financials are based on the most recent Mortgage that was taken out on this home.
Original Mortgage
$35,150
Interest Rate
7.52%
Mortgage Type
FHA
Purchase Details
Closed on
Apr 1, 1997
Sold by
Mitrisin Beverly S
Bought by
Federal Svgs Bank
Purchase Details
Closed on
Mar 24, 1992
Sold by
Mitrisin Beverly S
Bought by
Federal Svgs Bank
Create a Home Valuation Report for This Property
The Home Valuation Report is an in-depth analysis detailing your home's value as well as a comparison with similar homes in the area
Home Values in the Area
Average Home Value in this Area
Purchase History
| Date | Buyer | Sale Price | Title Company |
|---|---|---|---|
| Carrera Ramon | -- | -- | |
| Apodaca Juan | $37,000 | -- | |
| Federal Svgs Bank | $43,204 | -- | |
| Federal Svgs Bank | $43,204 | -- |
Source: Public Records
Mortgage History
| Date | Status | Borrower | Loan Amount |
|---|---|---|---|
| Open | Carrera Ramon | $48,720 | |
| Previous Owner | Apodaca Juan | $35,150 | |
| Closed | Carrera Ramon | $10,000 |
Source: Public Records
Tax History Compared to Growth
Tax History
| Year | Tax Paid | Tax Assessment Tax Assessment Total Assessment is a certain percentage of the fair market value that is determined by local assessors to be the total taxable value of land and additions on the property. | Land | Improvement |
|---|---|---|---|---|
| 2025 | $1,494 | $143,224 | -- | -- |
| 2024 | $1,494 | $130,204 | -- | -- |
| 2023 | $1,413 | $118,367 | $0 | $0 |
| 2022 | $3,342 | $107,606 | $0 | $0 |
| 2021 | $3,180 | $106,636 | $16,198 | $90,438 |
| 2020 | $2,809 | $88,931 | $16,198 | $72,733 |
| 2018 | $2,703 | $86,916 | $16,198 | $70,718 |
| 2017 | $2,635 | $86,201 | $16,198 | $70,003 |
| 2016 | $2,635 | $86,201 | $16,198 | $70,003 |
| 2015 | $1,531 | $86,201 | $16,198 | $70,003 |
| 2014 | $1,531 | $87,094 | $16,198 | $70,896 |
Source: Public Records
Map
Nearby Homes
- 7807 Porche St
- 205 Kelvin Ave
- 7860 Porche St
- 222 Kelvin Ave
- 223 Kelvin Ave
- 7874 Broadway Dr
- 310 Kelvin Ave
- 7920 Porche St
- 7798 Rosedale St
- 7925 Broadway Dr
- 7907 Alameda Ave
- 7952 Broadway Dr
- 8041 Broadway Dr
- 104 Chip Way
- 7632 Franklin Dr Unit 1-2
- 443 Cadwallader Dr
- 7909 La Jolla Dr
- 405 Lafayette Dr
- 423 N Carolina Dr
- 7921 Lirio Rd
- 217 Yolanda Dr
- 203 Maricela Dr
- 213 Yolanda Dr
- 200 Maricela Dr
- 205 Maricela Dr
- 220 Yolanda Dr
- 209 Yolanda Dr
- 224 Yolanda Dr
- 216 Yolanda Dr
- 204 Maricela Dr
- 212 Yolanda Dr
- 228 Yolanda Dr
- 235 Yolanda Dr
- 231640 7807 Porche St St
- 232 Yolanda Dr
- 208 Maricela Dr
- 7805 Porche St
- 7811 Porche St
- 209 Maricela Dr
- 208 Yolanda Dr