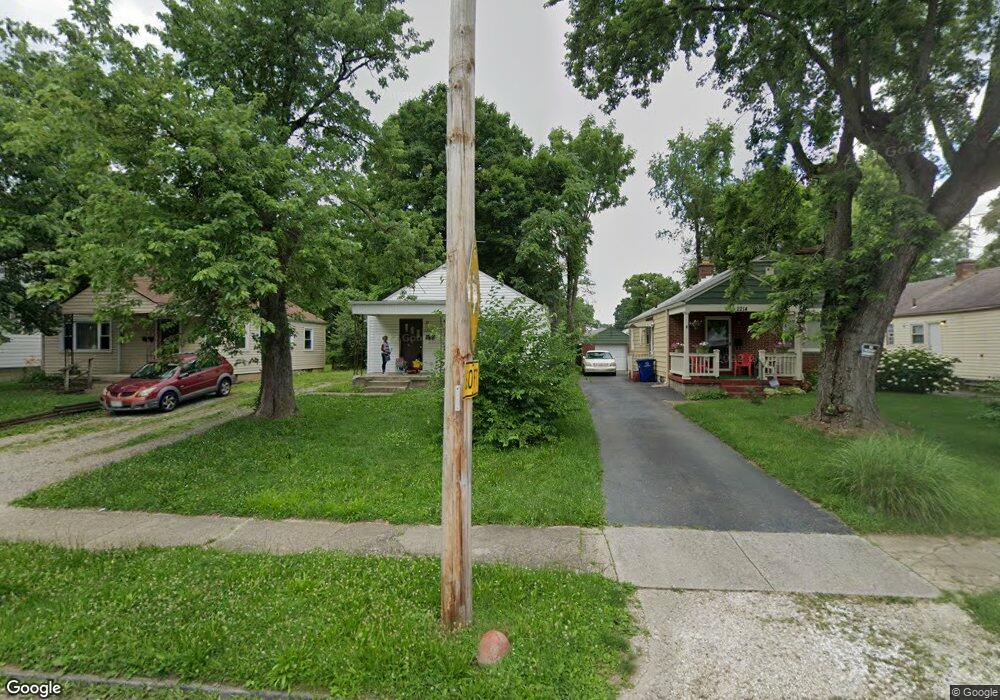
2210 Dartmouth Ave Columbus, OH 43219
Shepard NeighborhoodEstimated Value: $107,000 - $149,000
3
Beds
1
Bath
864
Sq Ft
$151/Sq Ft
Est. Value
About This Home
This home is located at 2210 Dartmouth Ave, Columbus, OH 43219 and is currently estimated at $130,880, approximately $151 per square foot. 2210 Dartmouth Ave is a home located in Franklin County with nearby schools including East Columbus Elementary School, Champion Middle School, and East High School.
Ownership History
Date
Name
Owned For
Owner Type
Purchase Details
Closed on
Jun 15, 2005
Sold by
Ihlenfield Jeff and Ihlenfield Laurie
Bought by
Rei Properties Llc
Current Estimated Value
Purchase Details
Closed on
Feb 23, 2005
Sold by
Absolute Property Solutions Llc
Bought by
Ihlenfield Jeff
Home Financials for this Owner
Home Financials are based on the most recent Mortgage that was taken out on this home.
Original Mortgage
$56,800
Interest Rate
5.22%
Mortgage Type
Purchase Money Mortgage
Purchase Details
Closed on
Sep 2, 2004
Sold by
Wachovia Bank Na
Bought by
Absolute Properties Llp
Purchase Details
Closed on
Jun 25, 2004
Sold by
Mullins Rainica and Case #03Cve05 5421
Bought by
Wachovia Bank Na and Long Beach Mortgage Loan Trust 2002-2
Purchase Details
Closed on
Mar 29, 2002
Sold by
Khuong Nhu Quynh
Bought by
Mullins Rainica
Purchase Details
Closed on
Apr 30, 2001
Sold by
Estate Of Marguerite Bannister
Bought by
William Sciacca Evalenne C and Williams Walter
Purchase Details
Closed on
Oct 14, 1961
Bought by
Bannister Marguerite
Create a Home Valuation Report for This Property
The Home Valuation Report is an in-depth analysis detailing your home's value as well as a comparison with similar homes in the area
Home Values in the Area
Average Home Value in this Area
Purchase History
| Date | Buyer | Sale Price | Title Company |
|---|---|---|---|
| Rei Properties Llc | -- | Valmer | |
| Ihlenfield Jeff | $71,000 | Valmer Land | |
| Absolute Properties Llp | $45,000 | Sovereign | |
| Wachovia Bank Na | $40,000 | -- | |
| Mullins Rainica | $69,000 | -- | |
| William Sciacca Evalenne C | -- | -- | |
| Bannister Marguerite | -- | -- |
Source: Public Records
Mortgage History
| Date | Status | Borrower | Loan Amount |
|---|---|---|---|
| Previous Owner | Ihlenfield Jeff | $56,800 |
Source: Public Records
Tax History Compared to Growth
Tax History
| Year | Tax Paid | Tax Assessment Tax Assessment Total Assessment is a certain percentage of the fair market value that is determined by local assessors to be the total taxable value of land and additions on the property. | Land | Improvement |
|---|---|---|---|---|
| 2024 | $1,869 | $40,780 | $7,420 | $33,360 |
| 2023 | $1,906 | $40,775 | $7,420 | $33,355 |
| 2022 | $930 | $11,660 | $2,800 | $8,860 |
| 2021 | $1,072 | $11,660 | $2,800 | $8,860 |
| 2020 | $622 | $11,660 | $2,800 | $8,860 |
| 2019 | $631 | $10,150 | $2,450 | $7,700 |
| 2018 | $586 | $10,150 | $2,450 | $7,700 |
| 2017 | $851 | $13,690 | $2,450 | $11,240 |
| 2016 | $595 | $8,760 | $2,840 | $5,920 |
| 2015 | $542 | $8,760 | $2,840 | $5,920 |
| 2014 | $543 | $8,760 | $2,840 | $5,920 |
| 2013 | $427 | $13,965 | $3,150 | $10,815 |
Source: Public Records
Map
Nearby Homes
- 2250 Willamont Ave
- 2287 Margaret Ave Unit 289
- 797 N Nelson Rd
- 2122 Margaret Ave
- 2268 Ridgeway Ave
- 2278 Ridgeway Ave Unit 278
- 440 N Nelson Rd
- 1961 Dartmouth Ave
- 2040 E 5th Ave
- 0 Wellington Blvd
- 2029 Maryland Ave
- 2143 Leonard Ave
- 2421 Airport Dr
- 1065 Sunbury Rd
- 691-693 N Dawson Ave
- 291 N Drexel Ave
- 782 Northview Ave
- 796 Northview Ave
- 2288 Woodward Ave
- 189 N Parkview Ave
- 2214 Dartmouth Ave
- 2204 Dartmouth Ave
- 2220 Dartmouth Ave
- 2200 Dartmouth Ave
- 2226 Dartmouth Ave
- 2230 Dartmouth Ave
- 2217 Willamont Ave
- 2221 Willamont Ave
- 2225 Willamont Ave
- 2236 Dartmouth Ave
- 2233 Willamont Ave
- 2209 Dartmouth Ave
- 2203 Dartmouth Ave
- 2213 Dartmouth Ave
- 727 Malvern Ave
- 723 Malvern Ave
- 2237 Willamont Ave
- 2199 Dartmouth Ave
- 2219 Dartmouth Ave
- 731 Malvern Ave