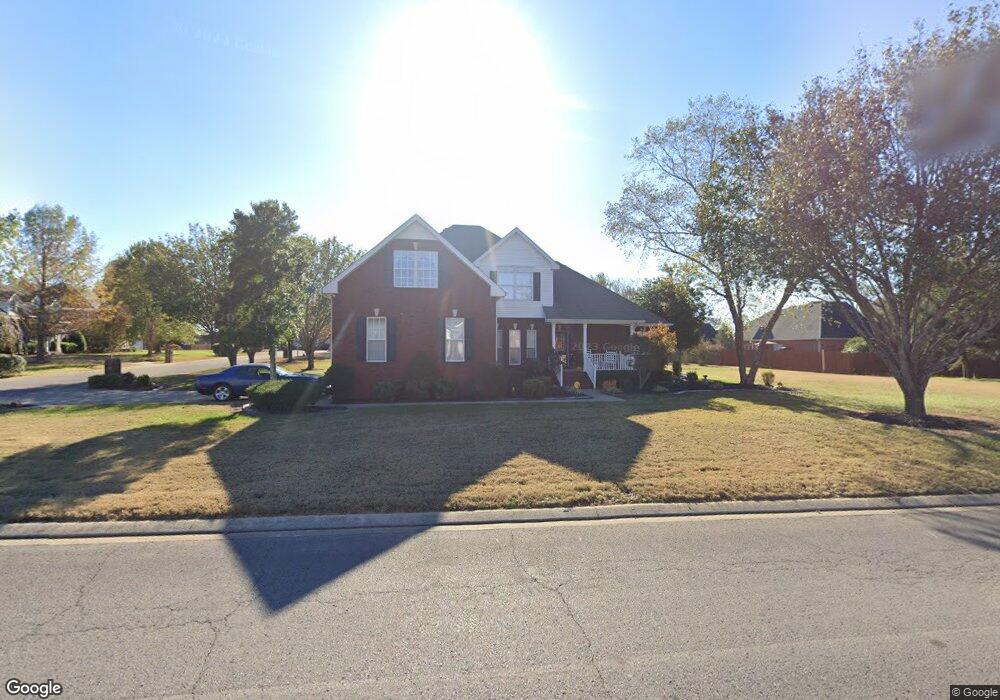
2210 Garrison Cove Murfreesboro, TN 37130
Estimated Value: $502,665 - $556,000
--
Bed
3
Baths
2,344
Sq Ft
$226/Sq Ft
Est. Value
About This Home
This home is located at 2210 Garrison Cove, Murfreesboro, TN 37130 and is currently estimated at $528,916, approximately $225 per square foot. 2210 Garrison Cove is a home located in Rutherford County with nearby schools including Discovery School, Reeves-Rogers Elementary School, and Oakland Middle School.
Ownership History
Date
Name
Owned For
Owner Type
Purchase Details
Closed on
Mar 24, 2006
Sold by
Waite Taylor Building
Bought by
Barrett James R and Barrett Tina M
Current Estimated Value
Home Financials for this Owner
Home Financials are based on the most recent Mortgage that was taken out on this home.
Original Mortgage
$199,900
Outstanding Balance
$113,375
Interest Rate
6.23%
Mortgage Type
Purchase Money Mortgage
Estimated Equity
$415,541
Purchase Details
Closed on
Dec 23, 2004
Sold by
Brown Mark W
Bought by
Waite Taylor Building Group
Purchase Details
Closed on
Dec 11, 1996
Sold by
Brown and Debra
Bought by
Meienburg Weldon R and Meienburg Marle
Purchase Details
Closed on
Jul 9, 1996
Sold by
Proctor and Marilyn
Bought by
Brown and Debra
Purchase Details
Closed on
Mar 4, 1996
Sold by
Southern Vision Homes
Bought by
Proctor and Marilyn
Purchase Details
Closed on
Feb 1, 1996
Sold by
Garrison Cove Venture
Bought by
Southern Vision Homes
Purchase Details
Closed on
Jan 22, 1996
Bought by
Fisher and Karen
Create a Home Valuation Report for This Property
The Home Valuation Report is an in-depth analysis detailing your home's value as well as a comparison with similar homes in the area
Home Values in the Area
Average Home Value in this Area
Purchase History
| Date | Buyer | Sale Price | Title Company |
|---|---|---|---|
| Barrett James R | $249,900 | -- | |
| Waite Taylor Building Group | $234,000 | -- | |
| Meienburg Weldon R | $189,900 | -- | |
| Brown | $184,900 | -- | |
| Proctor | $25,900 | -- | |
| Proctor | $24,900 | -- | |
| Southern Vision Homes | $27,900 | -- | |
| Fisher | $26,900 | -- |
Source: Public Records
Mortgage History
| Date | Status | Borrower | Loan Amount |
|---|---|---|---|
| Open | Fisher | $199,900 | |
| Closed | Fisher | $49,980 |
Source: Public Records
Tax History Compared to Growth
Tax History
| Year | Tax Paid | Tax Assessment Tax Assessment Total Assessment is a certain percentage of the fair market value that is determined by local assessors to be the total taxable value of land and additions on the property. | Land | Improvement |
|---|---|---|---|---|
| 2025 | $2,903 | $102,625 | $16,875 | $85,750 |
| 2024 | $2,903 | $102,625 | $16,875 | $85,750 |
| 2023 | $1,925 | $102,625 | $16,875 | $85,750 |
| 2022 | $1,659 | $102,625 | $16,875 | $85,750 |
| 2021 | $1,618 | $72,925 | $16,875 | $56,050 |
| 2020 | $1,618 | $72,925 | $16,875 | $56,050 |
| 2019 | $1,618 | $72,925 | $16,875 | $56,050 |
| 2018 | $2,223 | $72,925 | $0 | $0 |
| 2017 | $2,196 | $56,500 | $0 | $0 |
| 2016 | $2,196 | $56,500 | $0 | $0 |
| 2015 | $2,196 | $56,500 | $0 | $0 |
| 2014 | $1,405 | $56,500 | $0 | $0 |
| 2013 | -- | $58,325 | $0 | $0 |
Source: Public Records
Map
Nearby Homes
- 2110 Stillwell Ct
- 2427 Donald Bradley Ct
- 2303 Lionheart Dr
- 2331 Lionheart Dr
- 2164 White Poplar Ct
- 1913 Baskinbrook Ct
- 1437 Orange Ct
- 2111 Lovelace Ln
- 2553 Jackalope St
- 1420 Orange Ct
- 1414 Bunny Ct
- 2223 Brick Way
- 1303 Vermont Ct
- 1430 Avellino Cir
- 0 Pitts Ln
- 2315 Gold Valley Dr Unit B1
- 1512 Mirabella Way
- 2187 Gold Valley Dr
- 2153 Gold Valley Dr
- 2123 Gold Valley Dr
- 2013 Look Rock Ct
- 2211 Garrison Cove
- 2012 Stillwell Ct
- 2214 Garrison Cove
- 2009 Look Rock Ct
- 2014 Look Rock Ct
- 2102 Stillwell Ct
- 2215 Garrison Cove
- 2008 Stillwell Ct
- 2107 Look Rock Ct
- 2010 Look Rock Ct
- 2106 Stillwell Ct
- 2005 Look Rock Ct
- 2202 Garrison Cove
- 2015 Abrams Ct
- 2219 Garrison Cove
- 2015 Stillwell Ct
- 2002 Look Rock Ct
- 2004 Stillwell Ct
- 2203 Garrison Cove