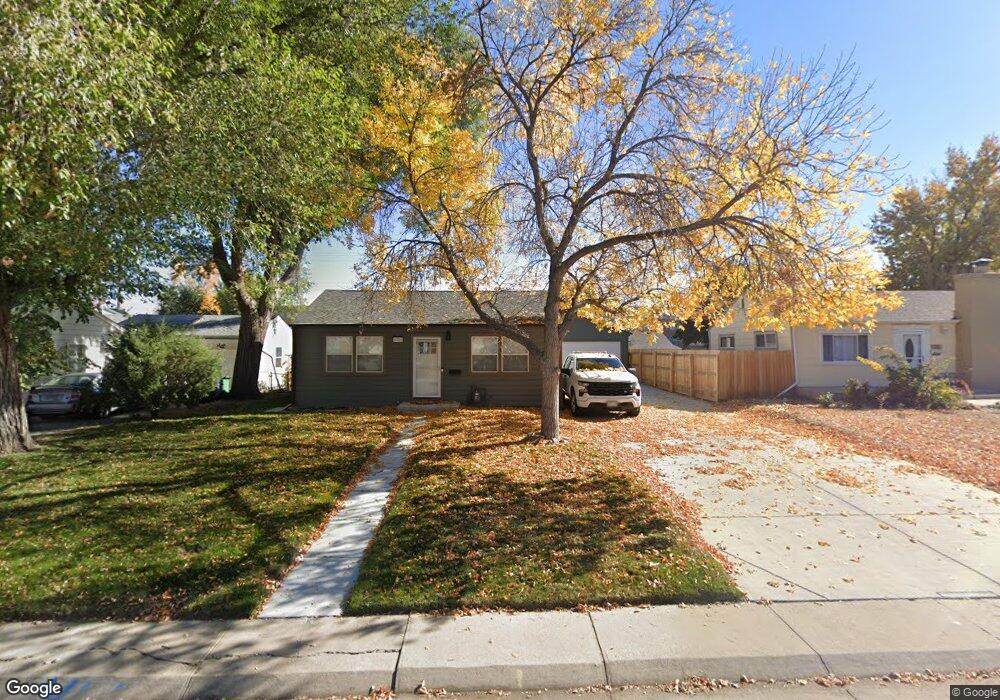
2210 S Hooker Way Denver, CO 80219
Harvey Park NeighborhoodEstimated Value: $419,000 - $497,000
2
Beds
1
Bath
1,176
Sq Ft
$385/Sq Ft
Est. Value
About This Home
This home is located at 2210 S Hooker Way, Denver, CO 80219 and is currently estimated at $452,978, approximately $385 per square foot. 2210 S Hooker Way is a home located in Denver County with nearby schools including Johnson Elementary School, Kepner Beacon Middle School, and West High School.
Ownership History
Date
Name
Owned For
Owner Type
Purchase Details
Closed on
May 8, 2017
Sold by
Leslie Lacey R and Broze Lacey R
Bought by
Stone Joel E
Current Estimated Value
Home Financials for this Owner
Home Financials are based on the most recent Mortgage that was taken out on this home.
Original Mortgage
$214,000
Outstanding Balance
$178,598
Interest Rate
4.23%
Mortgage Type
New Conventional
Estimated Equity
$274,380
Purchase Details
Closed on
Jul 25, 2005
Sold by
Broze Lacey R and Kneen Raymond K
Bought by
Broze Lacey R
Home Financials for this Owner
Home Financials are based on the most recent Mortgage that was taken out on this home.
Original Mortgage
$168,236
Interest Rate
5.65%
Mortgage Type
FHA
Purchase Details
Closed on
Jul 30, 2003
Sold by
Topp Keith A and Topp Christine C
Bought by
Broze Lacey R and Kneen Raymond D
Home Financials for this Owner
Home Financials are based on the most recent Mortgage that was taken out on this home.
Original Mortgage
$166,142
Interest Rate
5.24%
Mortgage Type
FHA
Create a Home Valuation Report for This Property
The Home Valuation Report is an in-depth analysis detailing your home's value as well as a comparison with similar homes in the area
Home Values in the Area
Average Home Value in this Area
Purchase History
| Date | Buyer | Sale Price | Title Company |
|---|---|---|---|
| Stone Joel E | $267,500 | Heritage Title Co | |
| Broze Lacey R | -- | -- | |
| Broze Lacey R | $168,750 | North American Title Co |
Source: Public Records
Mortgage History
| Date | Status | Borrower | Loan Amount |
|---|---|---|---|
| Open | Stone Joel E | $214,000 | |
| Previous Owner | Broze Lacey R | $168,236 | |
| Previous Owner | Broze Lacey R | $166,142 |
Source: Public Records
Tax History Compared to Growth
Tax History
| Year | Tax Paid | Tax Assessment Tax Assessment Total Assessment is a certain percentage of the fair market value that is determined by local assessors to be the total taxable value of land and additions on the property. | Land | Improvement |
|---|---|---|---|---|
| 2024 | $2,227 | $28,120 | $780 | $27,340 |
| 2023 | $2,179 | $28,120 | $780 | $27,340 |
| 2022 | $1,845 | $23,200 | $4,640 | $18,560 |
| 2021 | $1,845 | $23,870 | $4,770 | $19,100 |
| 2020 | $1,704 | $22,960 | $4,340 | $18,620 |
| 2019 | $1,656 | $22,960 | $4,340 | $18,620 |
| 2018 | $1,423 | $18,390 | $3,720 | $14,670 |
| 2017 | $1,418 | $18,390 | $3,720 | $14,670 |
| 2016 | $1,159 | $14,210 | $4,107 | $10,103 |
| 2015 | $1,110 | $14,210 | $4,107 | $10,103 |
| 2014 | $892 | $10,740 | $2,412 | $8,328 |
Source: Public Records
Map
Nearby Homes
- 2105 S Hazel Ct
- 2285 S Knox Ct
- 2380 S Julian St
- 3440 W Evans Ave
- 2505 S Hooker St
- 2081 S King St
- 3180 W Jewell Ave
- 1910 S Knox Ct
- 2370 S Meade St
- 1910 S King St
- 2699 W Iliff Ave
- 2236 S Osceola St
- 2605 S Knox Ct
- 1801 S Grove St
- 1845 S Federal Blvd
- 2455 S Newton St
- 2661 S Hooker St
- 1888 S Michigan Way
- 1863 S Lowell Blvd
- 2655 S Irving St
- 2200 S Hooker Way
- 2220 S Hooker Way
- 2215 S Hazel Ct
- 2160 S Hooker Way
- 2205 S Hazel Ct
- 2230 S Hooker Way
- 2225 S Hazel Ct
- 2215 S Hooker Way
- 2155 S Hazel Ct
- 2205 S Hooker Way
- 2201 S Hooker Way
- 2150 S Hooker Way
- 2235 S Hazel Ct
- 2240 S Hooker Way
- 2225 S Hooker Way
- 2155 S Hooker Way
- 2245 S Hazel Ct
- 2145 S Hazel Ct
- 2140 S Hooker Way
- 2235 S Hooker Way