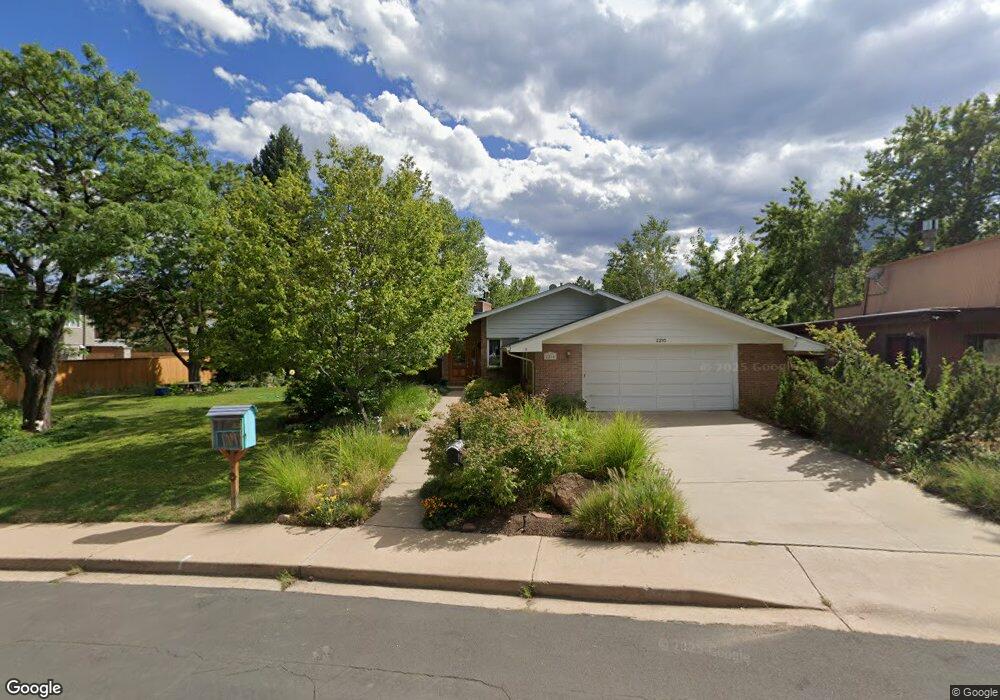
2210 Vassar Dr Boulder, CO 80305
Table Mesa NeighborhoodEstimated Value: $1,938,825 - $2,043,000
4
Beds
3
Baths
3,146
Sq Ft
$640/Sq Ft
Est. Value
About This Home
This home is located at 2210 Vassar Dr, Boulder, CO 80305 and is currently estimated at $2,012,706, approximately $639 per square foot. 2210 Vassar Dr is a home located in Boulder County with nearby schools including Bear Creek Elementary School, Southern Hills Middle School, and Fairview High School.
Ownership History
Date
Name
Owned For
Owner Type
Purchase Details
Closed on
Sep 23, 2013
Sold by
Barber Phillip D
Bought by
Barber Phillip D
Current Estimated Value
Purchase Details
Closed on
May 15, 2006
Sold by
Elings Michael Dean and Elings Michelle Lin
Bought by
Barber Phillip D
Home Financials for this Owner
Home Financials are based on the most recent Mortgage that was taken out on this home.
Original Mortgage
$293,750
Outstanding Balance
$170,128
Interest Rate
6.4%
Mortgage Type
Fannie Mae Freddie Mac
Estimated Equity
$1,842,578
Purchase Details
Closed on
Jun 19, 1998
Sold by
Elings Michael Dean
Bought by
Elings Michael Dean
Purchase Details
Closed on
Aug 15, 1994
Sold by
Beck Polly Stone and Beck William A
Bought by
Elings Michael Dean
Purchase Details
Closed on
Nov 20, 1992
Bought by
Barber Phillip D and Lapp Caroline L
Create a Home Valuation Report for This Property
The Home Valuation Report is an in-depth analysis detailing your home's value as well as a comparison with similar homes in the area
Home Values in the Area
Average Home Value in this Area
Purchase History
| Date | Buyer | Sale Price | Title Company |
|---|---|---|---|
| Barber Phillip D | -- | None Available | |
| Barber Phillip D | $795,000 | None Available | |
| Elings Michael Dean | -- | -- | |
| Elings Michael Dean | $290,000 | -- | |
| Barber Phillip D | -- | -- |
Source: Public Records
Mortgage History
| Date | Status | Borrower | Loan Amount |
|---|---|---|---|
| Open | Barber Phillip D | $293,750 |
Source: Public Records
Tax History
| Year | Tax Paid | Tax Assessment Tax Assessment Total Assessment is a certain percentage of the fair market value that is determined by local assessors to be the total taxable value of land and additions on the property. | Land | Improvement |
|---|---|---|---|---|
| 2025 | $10,865 | $121,251 | $99,013 | $22,238 |
| 2024 | $10,865 | $121,251 | $99,013 | $22,238 |
| 2023 | $10,676 | $130,328 | $105,840 | $28,173 |
| 2022 | $8,632 | $99,898 | $80,571 | $19,327 |
| 2021 | $8,231 | $102,773 | $82,890 | $19,883 |
| 2020 | $7,209 | $89,969 | $71,858 | $18,111 |
| 2019 | $7,712 | $89,969 | $71,858 | $18,111 |
| 2018 | $7,682 | $88,604 | $70,776 | $17,828 |
| 2017 | $7,442 | $97,956 | $78,247 | $19,709 |
| 2016 | $6,029 | $69,650 | $51,660 | $17,990 |
| 2015 | $5,709 | $64,937 | $28,178 | $36,759 |
| 2014 | $5,460 | $64,937 | $28,178 | $36,759 |
Source: Public Records
Map
Nearby Homes
- 2235 Vassar Dr
- 623 Hartford Dr
- 2585 Kohler Dr
- 2795 Vassar Dr
- 1965 Kohler Dr
- 1865 Kohler Dr
- 2955 Stanford Ave
- 2860 Table Mesa Dr
- 3000 Dartmouth Ave
- 3200 Eastman Ave
- 80 S 33rd St
- 245 Fair Place
- 1220 Edinboro Dr
- 345 S 38th St
- 2250 Bluebell Ave
- 3210 Emerson Ave
- 370 20th St
- 375 S 40th St
- 265 S 39th St
- 3450 Emerson Ave
- 2190 Vassar Dr
- 2250 Vassar Dr
- 2306 Dennison Ln
- 2160 Vassar Dr
- 2310 Dennison Ln
- 2290 Vassar Dr
- 2155 Hillsdale Cir
- 2125 Hillsdale Cir
- 2175 Hillsdale Cir
- 2130 Vassar Dr
- 2265 Vassar Dr
- 2265 Vassar Dr Unit Walkout Apartment
- 2300 Vassar Dr
- 2205 Vassar Dr
- 2195 Hillsdale Cir
- 2314 Dennison Ln
- 2195 Vassar Dr
- 2105 Hillsdale Cir
- 2295 Vassar Dr
- 2165 Vassar Dr
Your Personal Tour Guide
Ask me questions while you tour the home.