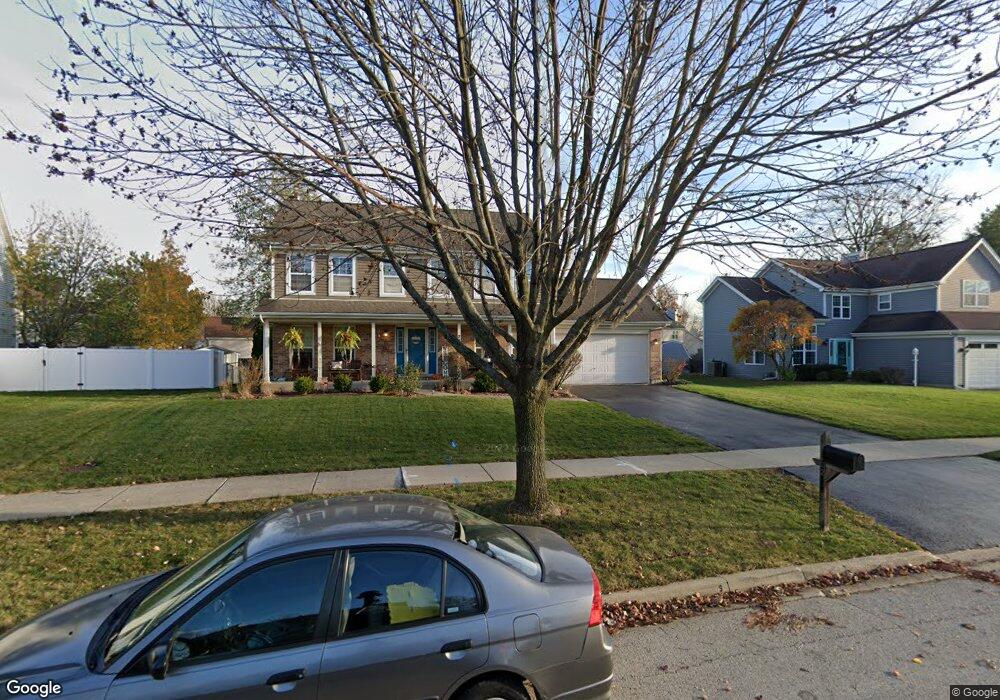
2210 Wynwood Ln Unit 1 Aurora, IL 60506
Blackberry Countryside NeighborhoodEstimated Value: $411,616 - $427,000
4
Beds
4
Baths
1,998
Sq Ft
$211/Sq Ft
Est. Value
About This Home
This home is located at 2210 Wynwood Ln Unit 1, Aurora, IL 60506 and is currently estimated at $420,904, approximately $210 per square foot. 2210 Wynwood Ln Unit 1 is a home located in Kane County with nearby schools including Freeman Elementary School, Washington Middle School, and West Aurora High School.
Ownership History
Date
Name
Owned For
Owner Type
Purchase Details
Closed on
Aug 29, 1997
Sold by
Farris Mark A and Farris Sharon
Bought by
Raymundo Rodolfo Q and Raymundo Rowena K
Current Estimated Value
Home Financials for this Owner
Home Financials are based on the most recent Mortgage that was taken out on this home.
Original Mortgage
$170,050
Interest Rate
7%
Purchase Details
Closed on
Jun 30, 1994
Sold by
Blackberry Creek Ltd Partnership
Bought by
Farris Mark A and Farris Sharon
Home Financials for this Owner
Home Financials are based on the most recent Mortgage that was taken out on this home.
Original Mortgage
$143,050
Interest Rate
8.61%
Create a Home Valuation Report for This Property
The Home Valuation Report is an in-depth analysis detailing your home's value as well as a comparison with similar homes in the area
Home Values in the Area
Average Home Value in this Area
Purchase History
| Date | Buyer | Sale Price | Title Company |
|---|---|---|---|
| Raymundo Rodolfo Q | $119,333 | Chicago Title Insurance Co | |
| Farris Mark A | $179,000 | Chicago Title Insurance Co |
Source: Public Records
Mortgage History
| Date | Status | Borrower | Loan Amount |
|---|---|---|---|
| Previous Owner | Raymundo Rodolfo Q | $170,050 | |
| Previous Owner | Farris Mark A | $143,050 |
Source: Public Records
Tax History Compared to Growth
Tax History
| Year | Tax Paid | Tax Assessment Tax Assessment Total Assessment is a certain percentage of the fair market value that is determined by local assessors to be the total taxable value of land and additions on the property. | Land | Improvement |
|---|---|---|---|---|
| 2024 | $8,162 | $111,087 | $20,956 | $90,131 |
| 2023 | $7,816 | $99,256 | $18,724 | $80,532 |
| 2022 | $7,249 | $87,890 | $17,084 | $70,806 |
| 2021 | $6,928 | $81,826 | $15,905 | $65,921 |
| 2020 | $7,362 | $84,636 | $14,773 | $69,863 |
| 2019 | $7,595 | $83,668 | $13,688 | $69,980 |
| 2018 | $7,110 | $77,217 | $12,661 | $64,556 |
| 2017 | $7,305 | $76,976 | $11,666 | $65,310 |
| 2016 | $7,407 | $75,723 | $12,654 | $63,069 |
| 2015 | -- | $66,086 | $10,881 | $55,205 |
| 2014 | -- | $61,728 | $10,465 | $51,263 |
| 2013 | -- | $60,591 | $8,253 | $52,338 |
Source: Public Records
Map
Nearby Homes
- 2351 Tanglewood Dr
- 375 S Constitution Dr
- 381 S Constitution Dr
- 387 S Constitution Dr
- 393 S Constitution Dr
- 405 S Constitution Dr
- 2350 Tanglewood Ct Unit 4
- 27 S Canterbury Rd
- 2220 Mayflower Dr
- 1730 W Galena Blvd Unit 402E
- Napa Plan at Prairie Meadows
- Siena Plan at Prairie Meadows
- Sonoma Plan at Prairie Meadows
- Rutherford Plan at Prairie Meadows
- 411 S Constitution Dr
- 417 S Constitution Dr
- 417 Cottrell Ln
- 2472 Worthington Dr
- 1751 Greene Ct
- 425 Cottrell Ln
- 2220 Wynwood Ln Unit 1
- 2200 Wynwood Ln
- 81 Cold Spring Ct
- 71 Cold Spring Ct Unit 1
- 61 Cold Spring Ct
- 91 Cold Spring Ct
- 2211 Wynwood Ln
- 2221 Wynwood Ln
- 2231 Wynwood Ln
- 101 Cold Spring Ct Unit 1
- 2230 Apple Hill Ln
- 70 Cold Spring Ct
- 80 Cold Spring Ct
- 2241 Wynwood Ln
- 100 Cold Spring Ct
- 2240 Apple Hill Ln
- 90 Cold Spring Ct
- 2250 Apple Hill Ln
- 2251 Wynwood Ln
- 2261 Wynwood Ln