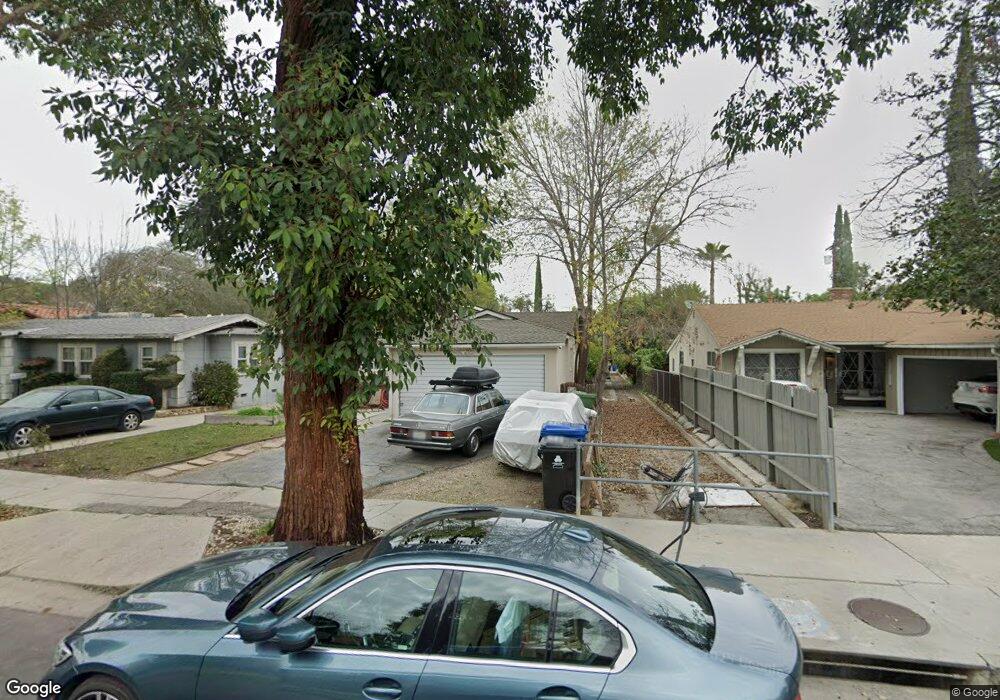
22101 Ybarra Rd Woodland Hills, CA 91364
Estimated Value: $951,680 - $1,122,000
3
Beds
2
Baths
1,322
Sq Ft
$765/Sq Ft
Est. Value
About This Home
This home is located at 22101 Ybarra Rd, Woodland Hills, CA 91364 and is currently estimated at $1,010,670, approximately $764 per square foot. 22101 Ybarra Rd is a home located in Los Angeles County with nearby schools including Woodland Hills Academy, Woodland Hills Elementary Charter For Enriched Studies, and Serrania Charter For Enriched Studies.
Ownership History
Date
Name
Owned For
Owner Type
Purchase Details
Closed on
May 10, 2024
Sold by
Bateman Family Trust and Bateman Charles
Bought by
Verrett Richard and Verrett Ericka
Current Estimated Value
Home Financials for this Owner
Home Financials are based on the most recent Mortgage that was taken out on this home.
Original Mortgage
$883,500
Outstanding Balance
$870,970
Interest Rate
6.82%
Mortgage Type
New Conventional
Estimated Equity
$139,700
Purchase Details
Closed on
Jul 17, 2020
Sold by
Bateman Charles W and Bateman Laura H
Bought by
Bateman Charles and Bateman Laura
Purchase Details
Closed on
Jun 17, 2020
Sold by
Bateman Charles and Bateman Laura
Bought by
Bateman Charles and Bateman Laura
Purchase Details
Closed on
Jun 5, 1998
Sold by
Wachter Orlyn
Bought by
Bateman Charles W and Bateman Laura H
Create a Home Valuation Report for This Property
The Home Valuation Report is an in-depth analysis detailing your home's value as well as a comparison with similar homes in the area
Home Values in the Area
Average Home Value in this Area
Purchase History
| Date | Buyer | Sale Price | Title Company |
|---|---|---|---|
| Verrett Richard | $930,000 | Stewart Title Of California In | |
| Bateman Charles | -- | None Available | |
| Bateman Charles | -- | None Available | |
| Bateman Charles W | -- | United Title Company |
Source: Public Records
Mortgage History
| Date | Status | Borrower | Loan Amount |
|---|---|---|---|
| Open | Verrett Richard | $883,500 |
Source: Public Records
Tax History Compared to Growth
Tax History
| Year | Tax Paid | Tax Assessment Tax Assessment Total Assessment is a certain percentage of the fair market value that is determined by local assessors to be the total taxable value of land and additions on the property. | Land | Improvement |
|---|---|---|---|---|
| 2025 | $3,479 | $948,600 | $728,484 | $220,116 |
| 2024 | $3,479 | $267,971 | $214,295 | $53,676 |
| 2023 | $3,415 | $262,718 | $210,094 | $52,624 |
| 2022 | $3,279 | $257,568 | $205,975 | $51,593 |
| 2021 | $3,235 | $252,519 | $201,937 | $50,582 |
| 2019 | $3,141 | $245,032 | $195,949 | $49,083 |
| 2018 | $3,098 | $240,228 | $192,107 | $48,121 |
| 2016 | $2,938 | $230,902 | $184,649 | $46,253 |
| 2015 | $2,897 | $227,435 | $181,876 | $45,559 |
| 2014 | $2,915 | $222,981 | $178,314 | $44,667 |
Source: Public Records
Map
Nearby Homes
- 22015 Independencia St
- 22002 Ybarra Rd
- 4780 San Feliciano Dr
- 22027 Viscanio Rd
- 4743 Topanga Canyon Blvd
- 22051 Mulholland Way
- 4841 Don Pio Dr
- 4616 Coyle Place
- 22263 Flanco Rd
- 22297 Buena Ventura St
- 4944 Don Pio Dr
- 4972 Topanga Canyon Blvd
- 22025 De la Osa St
- 22021 De la Osa St
- 4976 Llano Dr
- 21907 De la Osa St
- 4967 Llano Dr
- 4718 Galendo St
- 4825 Galendo St
- 21914 Velicata St
- 22109 Ybarra Rd
- 22059 Ybarra Rd
- 22113 Ybarra Rd
- 22053 Ybarra Rd
- 22100 Buena Ventura St
- 22106 Buena Ventura St
- 22056 Buena Ventura St
- 22056 Buenaventura St
- 22117 Ybarra Rd
- 22047 Ybarra Rd
- 22112 Buena Ventura St
- 22050 Buena Ventura St
- 22104 Ybarra Rd
- 22123 Ybarra Rd
- 22110 Ybarra Rd
- 22060 Ybarra Rd
- 22118 Buena Ventura St
- 22041 Ybarra Rd
- 22116 Ybarra Rd
- 22054 Ybarra Rd