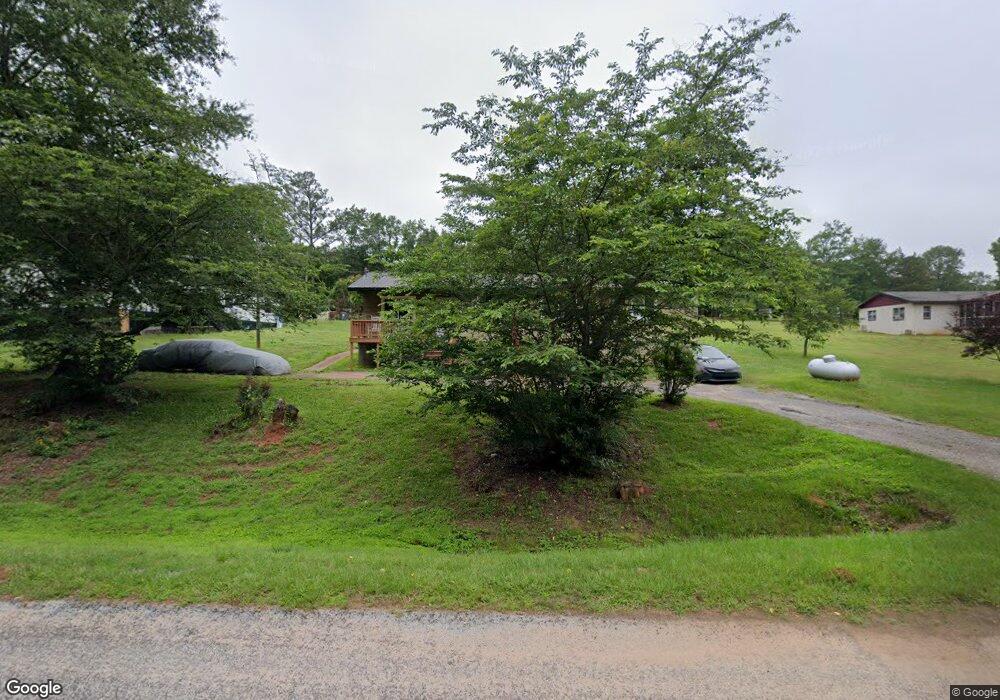
2211 Flint Rd Culloden, GA 31016
Estimated Value: $141,399 - $355,000
2
Beds
2
Baths
1,536
Sq Ft
$174/Sq Ft
Est. Value
About This Home
This home is located at 2211 Flint Rd, Culloden, GA 31016 and is currently estimated at $267,100, approximately $173 per square foot. 2211 Flint Rd is a home located in Monroe County with nearby schools including Samuel E. Hubbard Elementary School and Mary Persons High School.
Ownership History
Date
Name
Owned For
Owner Type
Purchase Details
Closed on
Jan 1, 1901
Bought by
Hughley Bruce
Current Estimated Value
Create a Home Valuation Report for This Property
The Home Valuation Report is an in-depth analysis detailing your home's value as well as a comparison with similar homes in the area
Purchase History
| Date | Buyer | Sale Price | Title Company |
|---|---|---|---|
| Hughley Bruce | -- | -- |
Source: Public Records
Tax History
| Year | Tax Paid | Tax Assessment Tax Assessment Total Assessment is a certain percentage of the fair market value that is determined by local assessors to be the total taxable value of land and additions on the property. | Land | Improvement |
|---|---|---|---|---|
| 2025 | -- | $31,748 | $0 | $31,748 |
| 2024 | -- | $31,748 | $0 | $31,748 |
| 2023 | $0 | $26,628 | $0 | $26,628 |
| 2022 | $746 | $26,628 | $0 | $26,628 |
| 2021 | $746 | $26,628 | $0 | $26,628 |
| 2020 | $765 | $26,628 | $0 | $26,628 |
| 2019 | $771 | $26,628 | $0 | $26,628 |
| 2018 | $0 | $26,628 | $0 | $26,628 |
| 2017 | $507 | $17,440 | $0 | $17,440 |
| 2016 | $482 | $17,440 | $0 | $17,440 |
| 2015 | $457 | $17,440 | $0 | $17,440 |
| 2014 | $441 | $17,440 | $0 | $17,440 |
Source: Public Records
Map
Nearby Homes
- 331 Worsham Rd
- 227 Fuller Rd
- 1787 Ramah Church Rd
- 305 Zellner Rd
- 1721 Old Zebulon Rd
- 336 Means Rd
- 4 Hopewell Rd
- 741 Pine Grove Church Rd
- 202 Community House Rd
- 208 Community House Rd
- 251 Russellville Rd
- 4866 Georgia 42
- 0 Old Zebulon Rd Unit 26510556
- 0 Old Zebulon Rd Unit 10697483
- 937 Hopewell Rd
- 1003 Hopewell Rd
- 342 Ramah Church Rd
- TRACT 6 Ramah Church Rd Unit 6
- TRACT 9 Ramah Church Rd Unit 9
- 271 Presidents Way
- 2211 Flint Rd
- 2191 Flint Rd
- 4758 Ga Highway 83 S
- 2149 Flint Rd
- 4736 Ga Highway 83 S
- 33 Wood Valley Ln
- 28 Wood Valley Ln
- 2115 Flint Rd
- 45 Wood Valley Ln
- 4704 Ga Highway 83 S
- 0 Wood Valley Ln Unit 7155813
- 0 Wood Valley Ln Unit M123293
- 4684 Ga Highway 83 S
- 2081 Flint Rd Unit 2
- 2081 Flint Rd
- 4675 Ga Highway 83 S
- 2049 Flint Rd
- 2039 Flint Rd
- 4636 Ga Highway 83 S
- 4990 Ga Highway 83 S
Your Personal Tour Guide
Ask me questions while you tour the home.