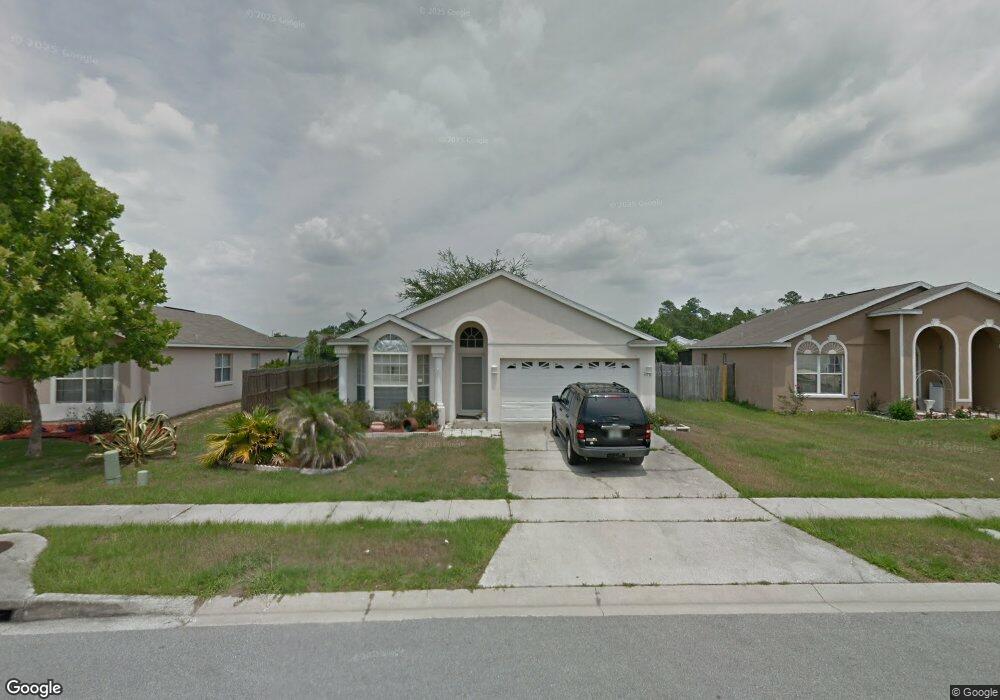
2211 Justin Ave Orlando, FL 32826
Estimated Value: $322,000 - $351,000
3
Beds
2
Baths
1,156
Sq Ft
$291/Sq Ft
Est. Value
About This Home
This home is located at 2211 Justin Ave, Orlando, FL 32826 and is currently estimated at $336,823, approximately $291 per square foot. 2211 Justin Ave is a home located in Orange County with nearby schools including Bonneville Elementary School, Corner Lake Middle School, and East River High School.
Ownership History
Date
Name
Owned For
Owner Type
Purchase Details
Closed on
Apr 1, 2018
Sold by
Enke Rosa M
Bought by
Enke Allmani Andrea R
Current Estimated Value
Purchase Details
Closed on
Jan 23, 2004
Sold by
Albino Felix A and Albino Alida E
Bought by
Enke Rosa
Home Financials for this Owner
Home Financials are based on the most recent Mortgage that was taken out on this home.
Original Mortgage
$70,000
Interest Rate
5.87%
Mortgage Type
Purchase Money Mortgage
Purchase Details
Closed on
Mar 17, 2000
Sold by
Bob Harrell Properties Inc
Bought by
Albino Felix A and Albino Alida E
Home Financials for this Owner
Home Financials are based on the most recent Mortgage that was taken out on this home.
Original Mortgage
$88,250
Interest Rate
8.29%
Mortgage Type
New Conventional
Create a Home Valuation Report for This Property
The Home Valuation Report is an in-depth analysis detailing your home's value as well as a comparison with similar homes in the area
Home Values in the Area
Average Home Value in this Area
Purchase History
| Date | Buyer | Sale Price | Title Company |
|---|---|---|---|
| Enke Allmani Andrea R | $20,000 | None Available | |
| Enke Rosa | $130,000 | Watson Title Services Inc | |
| Albino Felix A | $92,900 | -- |
Source: Public Records
Mortgage History
| Date | Status | Borrower | Loan Amount |
|---|---|---|---|
| Previous Owner | Enke Rosa | $70,000 | |
| Previous Owner | Albino Felix A | $130,000 | |
| Previous Owner | Albino Felix A | $25,000 | |
| Previous Owner | Albino Felix A | $88,250 |
Source: Public Records
Tax History Compared to Growth
Tax History
| Year | Tax Paid | Tax Assessment Tax Assessment Total Assessment is a certain percentage of the fair market value that is determined by local assessors to be the total taxable value of land and additions on the property. | Land | Improvement |
|---|---|---|---|---|
| 2025 | $4,714 | $273,830 | $65,000 | $208,830 |
| 2024 | $4,230 | $263,850 | $65,000 | $198,850 |
| 2023 | $4,230 | $249,074 | $65,000 | $184,074 |
| 2022 | $3,813 | $219,665 | $65,000 | $154,665 |
| 2021 | $3,570 | $201,542 | $52,500 | $149,042 |
| 2020 | $3,405 | $202,755 | $52,500 | $150,255 |
| 2019 | $3,250 | $178,433 | $45,000 | $133,433 |
| 2018 | $1,639 | $130,452 | $0 | $0 |
| 2017 | $1,600 | $127,769 | $23,000 | $104,769 |
| 2016 | $2,406 | $123,105 | $21,500 | $101,605 |
| 2015 | $2,260 | $111,602 | $21,000 | $90,602 |
| 2014 | $960 | $103,125 | $21,000 | $82,125 |
Source: Public Records
Map
Nearby Homes
- 2303 Bonneville Dr
- 13504 Glasser Ave
- 13927 Countryplace Dr
- 2142 Sorority Ct Unit 464
- 2506 Bonneville Dr
- 2043 Scranton Ave Unit 340
- 2137 Scranton Ave
- 13623 Brigham Young Dr Unit 410
- 1978 Scranton Ave Unit 365
- 2016 Stadium Ct Unit 381
- 2175 Scranton Ave Unit 301
- 1962 Scranton Ave
- 2728 Hertha Ave
- 2200 Scranton Ave Unit 512
- 2713 Geoffrey Dr
- 14063 Ithaca Way
- 1930 Skidmore Ave
- 13632 Youngstown Ave Unit 56
- 1939 Annapolis Ave Unit 50
- 2904 Allison Dr