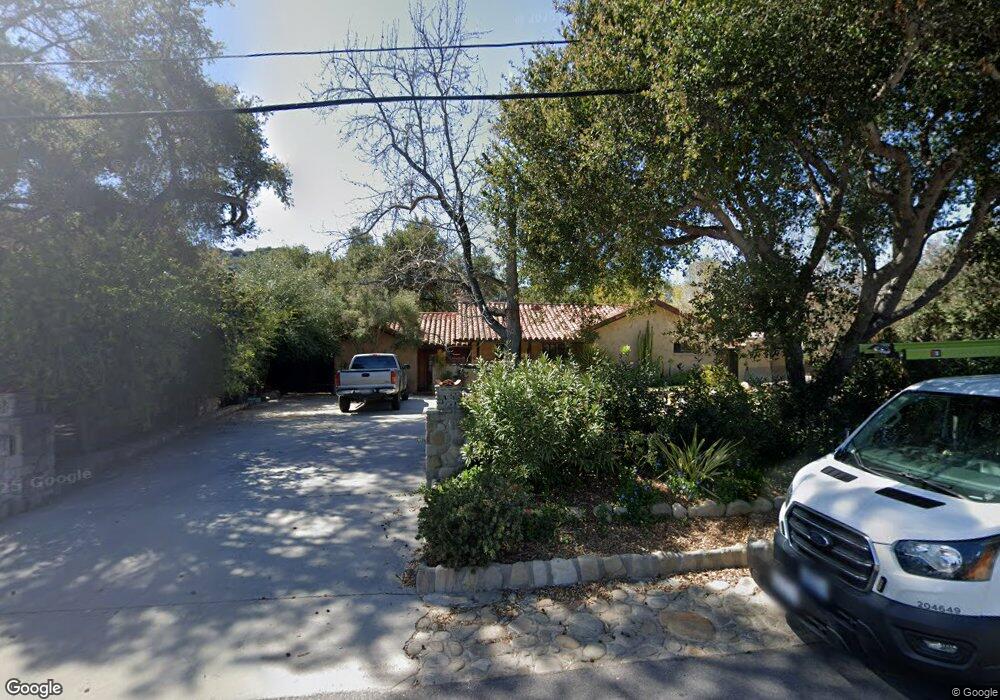
2211 Los Encinos Rd Ojai, CA 93023
Mira Monte NeighborhoodEstimated Value: $1,055,602 - $1,282,000
3
Beds
2
Baths
1,462
Sq Ft
$792/Sq Ft
Est. Value
About This Home
This home is located at 2211 Los Encinos Rd, Ojai, CA 93023 and is currently estimated at $1,158,401, approximately $792 per square foot. 2211 Los Encinos Rd is a home located in Ventura County with nearby schools including Sunset Elementary School, De Anza Academy Of Technology And The Arts, and Ventura High School.
Ownership History
Date
Name
Owned For
Owner Type
Purchase Details
Closed on
Nov 19, 2008
Sold by
Chasse Scott
Bought by
Chasse Scott
Current Estimated Value
Purchase Details
Closed on
Mar 20, 2007
Sold by
Chasse Scott
Bought by
Chasse Scott
Home Financials for this Owner
Home Financials are based on the most recent Mortgage that was taken out on this home.
Original Mortgage
$505,000
Interest Rate
5.86%
Mortgage Type
New Conventional
Purchase Details
Closed on
Jan 18, 2001
Sold by
Manasson Dominique
Bought by
Chasse Scott
Purchase Details
Closed on
Dec 29, 2000
Sold by
Chasse Scott
Bought by
Manasson Dominique
Purchase Details
Closed on
Aug 26, 1998
Sold by
Donald S Colvin Trust and Donald S
Bought by
Chasse Scott and Manasson Dominique
Home Financials for this Owner
Home Financials are based on the most recent Mortgage that was taken out on this home.
Original Mortgage
$294,000
Interest Rate
6.57%
Create a Home Valuation Report for This Property
The Home Valuation Report is an in-depth analysis detailing your home's value as well as a comparison with similar homes in the area
Home Values in the Area
Average Home Value in this Area
Purchase History
| Date | Buyer | Sale Price | Title Company |
|---|---|---|---|
| Chasse Scott | -- | None Available | |
| Chasse Scott | -- | Gateway Title Company | |
| Chasse Scott | -- | First American Title Ins Co | |
| Manasson Dominique | -- | Old Republic Title Company | |
| Chasse Scott | $367,500 | First American Title Ins |
Source: Public Records
Mortgage History
| Date | Status | Borrower | Loan Amount |
|---|---|---|---|
| Closed | Chasse Scott | $505,000 | |
| Previous Owner | Chasse Scott | $294,000 |
Source: Public Records
Tax History Compared to Growth
Tax History
| Year | Tax Paid | Tax Assessment Tax Assessment Total Assessment is a certain percentage of the fair market value that is determined by local assessors to be the total taxable value of land and additions on the property. | Land | Improvement |
|---|---|---|---|---|
| 2025 | $6,207 | $576,104 | $391,917 | $184,187 |
| 2024 | $6,207 | $564,808 | $384,232 | $180,576 |
| 2023 | $6,130 | $553,734 | $376,698 | $177,036 |
| 2022 | $5,707 | $542,877 | $369,312 | $173,565 |
| 2021 | $5,596 | $532,233 | $362,071 | $170,162 |
| 2020 | $5,542 | $526,777 | $358,359 | $168,418 |
| 2019 | $5,437 | $516,449 | $351,333 | $165,116 |
| 2018 | $5,345 | $506,324 | $344,445 | $161,879 |
| 2017 | $5,231 | $496,397 | $337,692 | $158,705 |
| 2016 | $5,127 | $486,665 | $331,071 | $155,594 |
| 2015 | $5,071 | $479,356 | $326,099 | $153,257 |
| 2014 | $4,987 | $469,968 | $319,712 | $150,256 |
Source: Public Records
Map
Nearby Homes
- 1180 Bonmark Dr
- 0 2 Burnham Rd
- 12140 Macdonald Dr
- 1182 Lake Ave
- 12250 Linda Flora Dr
- 86 Willey St
- 11195 N Ventura Ave Unit SP11
- 0 Rose Valley Rd Unit 25-3178
- 0 Rose Valley Rd Unit 224658
- 11220 N Ventura Ave
- 950 Woodland Ave Unit 78
- 950 Woodland Ave Unit 115
- 950 Woodland Ave Unit 123
- 950 Woodland Ave Unit 59
- 35 Catalina Dr
- 335 Burnham Rd
- 11881 Silver Spur St
- 1400 Park Dr
- 10980 N Ventura Ave
- 10920 Ventura Ave
- 2203 Los Encinos Rd
- 2217 Los Encinos Rd
- 2187 Los Encinos Rd
- 2225 Los Encinos Rd
- 2212 Los Encinos Rd
- 2169 Los Encinos Rd
- 2194 Los Encinos Rd
- 2230 Los Encinos Rd
- 2235 Los Encinos Rd
- 2164 Los Encinos Rd
- 2155 Los Encinos Rd
- 2198 Los Encinos Rd
- 2143 Los Encinos Rd
- 2243 Los Encinos Rd
- 2246 Los Encinos Rd
- 2144 Los Encinos Rd
- 2121 Los Encinos Rd
- 2148 Los Encinos Rd
- 2117 Los Encinos Rd
- 2250 Los Encinos Rd