Estimated Value: $598,213 - $643,000
4
Beds
4
Baths
3,334
Sq Ft
$185/Sq Ft
Est. Value
About This Home
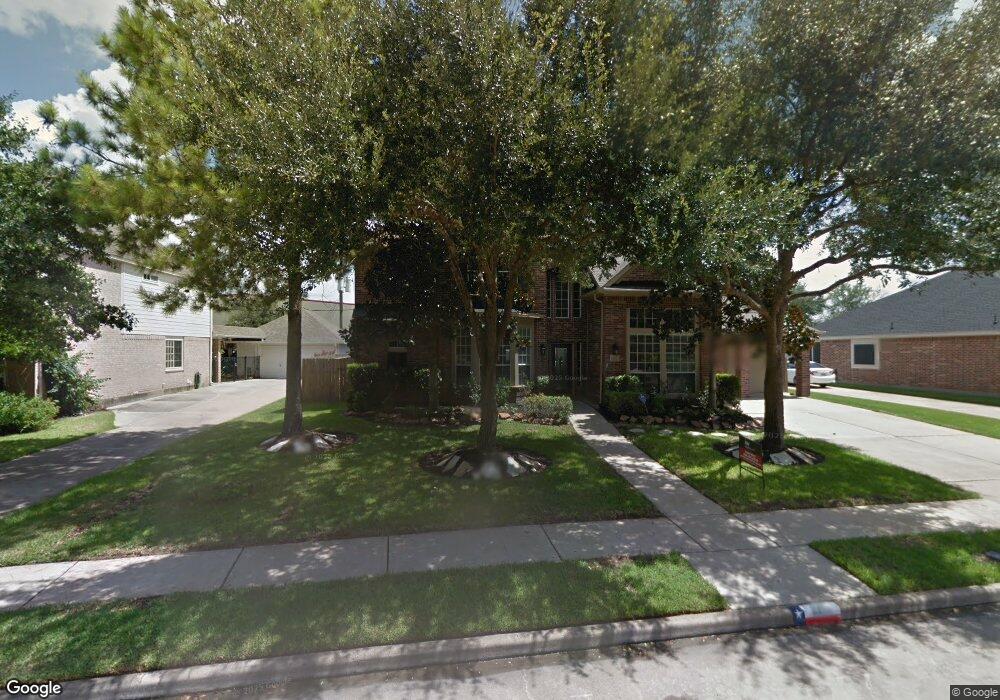
This home is located at 2211 Merrill Hills Cir, Katy, TX 77450 and is currently estimated at $615,803, approximately $184 per square foot. 2211 Merrill Hills Cir is a home located in Harris County with nearby schools including James E Williams Elementary School, Rodger & Ellen Beck Junior High, and Cinco Ranch High School.
Ownership History
Date
Name
Owned For
Owner Type
Purchase Details
Closed on
Sep 28, 2020
Sold by
Amare Rodrigo B
Bought by
Tarragona Properties Llc
Current Estimated Value
Purchase Details
Closed on
Aug 26, 2020
Sold by
Amare Rodrigo B
Bought by
Amare Rodrigo B
Purchase Details
Closed on
May 22, 2017
Sold by
Tarragona Properties Llc
Bought by
Amare Rodrigo B
Home Financials for this Owner
Home Financials are based on the most recent Mortgage that was taken out on this home.
Original Mortgage
$318,750
Interest Rate
4.1%
Mortgage Type
New Conventional
Purchase Details
Closed on
Aug 11, 2016
Sold by
Krnavek Nancy Venezia and Krnavek Donnie
Bought by
Tarrgona Properties Llc
Purchase Details
Closed on
Mar 5, 1999
Sold by
Weekley Homes Lp
Bought by
Krnavek Nancy Venezia
Create a Home Valuation Report for This Property
The Home Valuation Report is an in-depth analysis detailing your home's value as well as a comparison with similar homes in the area
Home Values in the Area
Average Home Value in this Area
Purchase History
| Date | Buyer | Sale Price | Title Company |
|---|---|---|---|
| Tarragona Properties Llc | -- | None Listed On Document | |
| Amare Rodrigo B | -- | Superior Title | |
| Amare Rodrigo B | -- | None Available | |
| Tarrgona Properties Llc | -- | None Available | |
| Krnavek Nancy Venezia | -- | Priority Title Company |
Source: Public Records
Mortgage History
| Date | Status | Borrower | Loan Amount |
|---|---|---|---|
| Previous Owner | Amare Rodrigo B | $318,750 |
Source: Public Records
Tax History Compared to Growth
Tax History
| Year | Tax Paid | Tax Assessment Tax Assessment Total Assessment is a certain percentage of the fair market value that is determined by local assessors to be the total taxable value of land and additions on the property. | Land | Improvement |
|---|---|---|---|---|
| 2025 | $9,488 | $601,481 | $117,492 | $483,989 |
| 2024 | $9,488 | $579,397 | $117,492 | $461,905 |
| 2023 | $9,488 | $578,127 | $117,492 | $460,635 |
| 2022 | $11,464 | $519,987 | $117,492 | $402,495 |
| 2021 | $9,972 | $427,363 | $78,328 | $349,035 |
| 2020 | $9,715 | $394,945 | $63,642 | $331,303 |
| 2019 | $10,129 | $396,947 | $63,642 | $333,305 |
| 2018 | $6,428 | $360,000 | $63,642 | $296,358 |
| 2017 | $10,835 | $360,000 | $63,642 | $296,358 |
| 2016 | $11,902 | $425,026 | $63,642 | $361,384 |
| 2015 | $6,037 | $425,026 | $63,642 | $361,384 |
| 2014 | $6,037 | $363,694 | $63,642 | $300,052 |
Source: Public Records
Map
Nearby Homes
- 22002 Treesdale Ln
- 2106 Bevington Oaks Cir
- 2010 Briarchester Dr
- 2142 Bluffton Ln
- 1930 Bevington Oaks Cir
- 3116 Wild Dunes Cir
- 3024 Wild Dunes Cir
- 3029 Wild Dunes Cir
- 3049 Wild Dunes Cir
- 3051 Wild Dunes Cir
- 3005 Wild Dunes Cir
- 1939 Cornerstone Place Dr
- 2130 White Eagle Ln
- 22015 Fielder Dr
- 2914 Hollinwell Dr
- 2110 Wild Dunes Cir
- 21550 Elm Hurst Ln
- 21510 Tallow Grove Ln
- 1902 Winding Hollow Dr
- 2246 Rocky Hollow Ln
- 2211 Merrill Hills Cir
- 2215 Merrill Hills Cir
- 2215 Merrill Hills Cir
- 2207 Merrill Hills Cir
- 2219 Merrill Hills Cir
- 2203 Merrill Hills Cir
- 2210 Merrill Hills Cir
- 2214 Merrill Hills Cir
- 2218 Merrill Hills Cir
- 2206 Merrill Hills Cir
- 2223 Merrill Hills Cir
- 22202 N Lake Village Dr
- 2222 Merrill Hills Cir
- 22118 N Lake Village Dr
- 22122 N Lake Village Dr
- 22122 N Lake Village Dr
- 22206 N Lake Village Dr
- 2227 Merrill Hills Cir
- 22114 N Lake Village Dr
- 22127 N Lake Village Dr