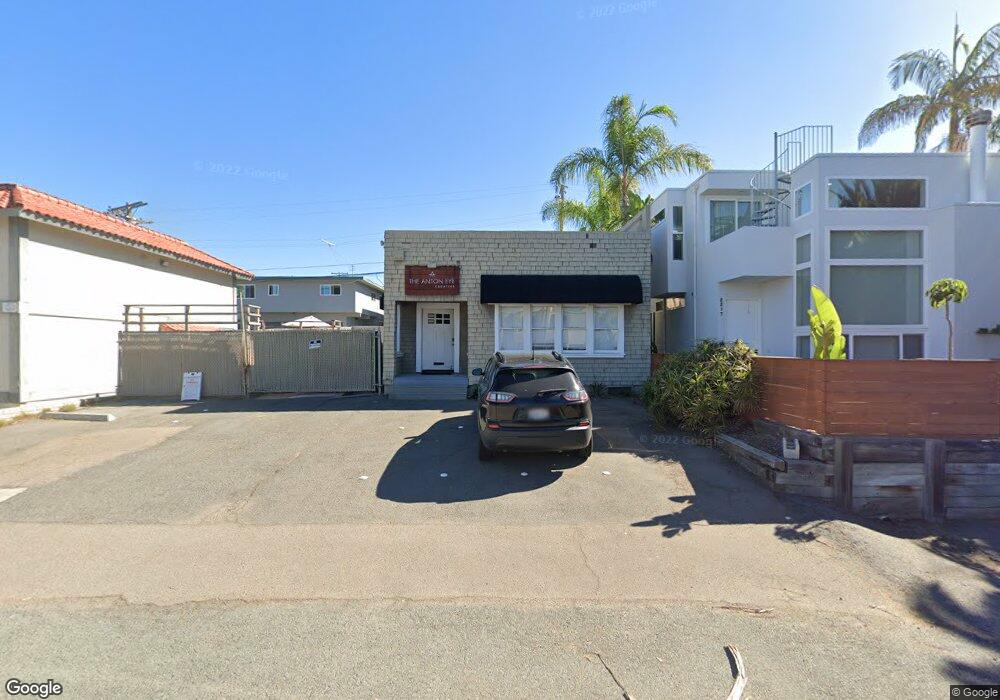
2211 Newcastle Ave Cardiff By the Sea, CA 92007
Cardiff-by-the-Sea NeighborhoodEstimated Value: $3,092,286
--
Bed
--
Bath
1,050
Sq Ft
$2,945/Sq Ft
Est. Value
About This Home
This home is located at 2211 Newcastle Ave, Cardiff By the Sea, CA 92007 and is currently estimated at $3,092,286, approximately $2,945 per square foot. 2211 Newcastle Ave is a home located in San Diego County with nearby schools including Cardiff Elementary, Ada W. Harris Elementary, and Oak Crest Middle School.
Ownership History
Date
Name
Owned For
Owner Type
Purchase Details
Closed on
Jan 7, 2021
Sold by
Terral Investment Company
Bought by
2211 Newcastle Llc
Current Estimated Value
Purchase Details
Closed on
Dec 14, 2018
Sold by
Thiel Julia
Bought by
Thiel Mark
Purchase Details
Closed on
Dec 12, 2018
Sold by
Patel Jigar and Patel Dev
Bought by
Terral Investment Co
Purchase Details
Closed on
Sep 7, 2017
Sold by
Patel Kathryn Elizabeth
Bought by
Patel Jigar
Purchase Details
Closed on
Aug 30, 2017
Sold by
Seaside Investments Llc
Bought by
Patel Jigar and Patel Dev
Purchase Details
Closed on
Feb 9, 2017
Sold by
Najjar Enterprises Llc
Bought by
Seaside Investments Llc
Purchase Details
Closed on
Dec 28, 2015
Sold by
Fredricks Michael W and Fredricks Renee J
Bought by
Najjar Enterprises Llc
Purchase Details
Closed on
Apr 26, 1990
Purchase Details
Closed on
Jul 14, 1986
Create a Home Valuation Report for This Property
The Home Valuation Report is an in-depth analysis detailing your home's value as well as a comparison with similar homes in the area
Home Values in the Area
Average Home Value in this Area
Purchase History
| Date | Buyer | Sale Price | Title Company |
|---|---|---|---|
| 2211 Newcastle Llc | -- | Accommodation | |
| Thiel Mark | -- | Chicago Title Company | |
| Terral Investment Co | $1,500,000 | Chicago Title Company | |
| Patel Jigar | -- | Stewart Title Of California | |
| Patel Jigar | $1,350,000 | None Available | |
| Seaside Investments Llc | $1,300,000 | Chicago Title Company | |
| Najjar Enterprises Llc | $1,200,000 | Chicago Title Company | |
| -- | $275,000 | -- | |
| -- | $180,000 | -- |
Source: Public Records
Tax History Compared to Growth
Tax History
| Year | Tax Paid | Tax Assessment Tax Assessment Total Assessment is a certain percentage of the fair market value that is determined by local assessors to be the total taxable value of land and additions on the property. | Land | Improvement |
|---|---|---|---|---|
| 2025 | $18,043 | $1,673,274 | $1,561,724 | $111,550 |
| 2024 | $18,043 | $1,640,465 | $1,531,102 | $109,363 |
| 2023 | $17,654 | $1,608,300 | $1,501,081 | $107,219 |
| 2022 | $17,356 | $1,576,766 | $1,471,649 | $105,117 |
| 2021 | $17,125 | $1,545,850 | $1,442,794 | $103,056 |
| 2020 | $17,004 | $1,530,000 | $1,428,000 | $102,000 |
| 2019 | $16,676 | $1,500,000 | $1,400,000 | $100,000 |
| 2018 | $14,999 | $1,350,000 | $1,150,000 | $200,000 |
| 2017 | $13,530 | $1,224,000 | $1,122,000 | $102,000 |
| 2016 | $4,712 | $427,372 | $349,677 | $77,695 |
| 2015 | $4,641 | $420,953 | $344,425 | $76,528 |
| 2014 | $4,549 | $412,708 | $337,679 | $75,029 |
Source: Public Records
Map
Nearby Homes
- 2319-21 Newcastle Ave
- 2311 Montgomery Ave
- 2052 Montgomery Ave
- 2262 Cambridge Ave
- 509 Chesterfield Dr
- 1915 Montgomery Ave
- 165 Kilkenny Dr
- 2034-36 Mackinnon Ave
- 2542 Manchester Ave Unit U2
- 240 Birmingham Dr Unit 19 & 20
- 445 Sheffield Ave
- 417 Warwick Ave
- 1007 Genie Ln
- 1470 Rubenstein Ave
- 2422 Caminito Ocean Cove
- 1219 Avocet Ct
- 2051 Wales Dr
- 835 Cathy Ln
- 1320 Evergreen Dr
- 1422 Caminito Septimo
- 2211 2211 Newcastle Ave
- 2217 Newcastle Ave
- 2219 Newcastle Ave
- 2225 Newcastle Ave
- 219 Chesterfield Dr
- 2220A Manchester Ave Unit D
- 2227 Newcastle Ave
- 2212A Manchester Ave Unit D
- 2228A Manchester Ave Unit D
- 2140 Orinda Dr
- 2140 Orinda Dr Unit F
- 2140 Orinda Dr Unit G
- 2140 Orinda Dr Unit E
- 2140 Orinda Dr Unit D
- 2140 Orinda Dr Unit C
- 2140 Orinda Dr Unit B
- 2140 Orinda Dr Unit A
- 2140 Orinda Dr Unit N
- 2140 Orinda Dr Unit M
- 2140 Orinda Dr Unit L