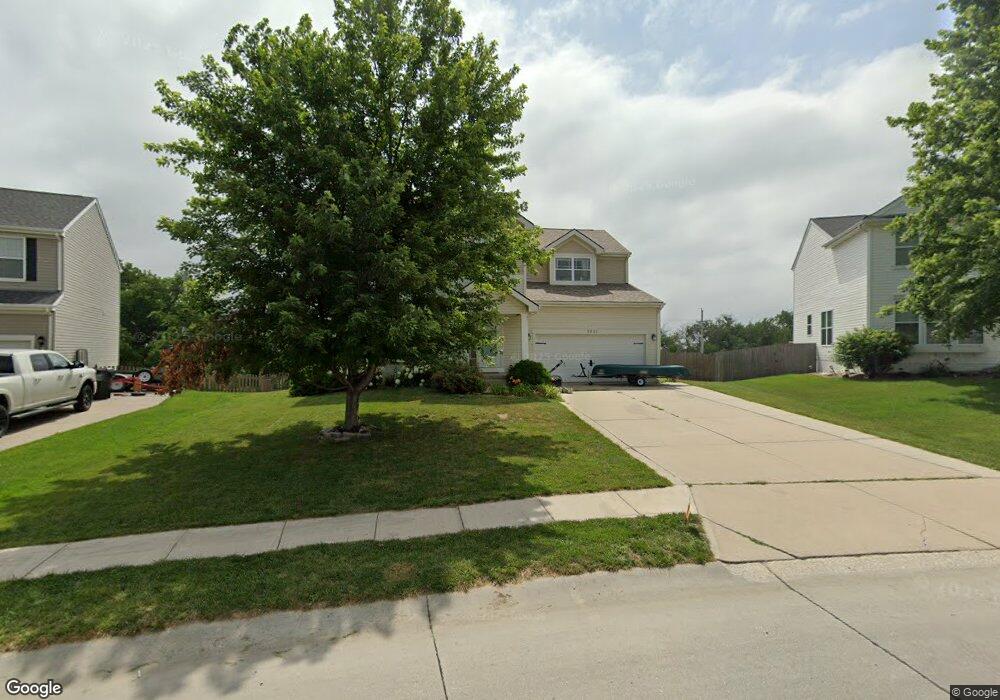
2211 S River Rock Dr Papillion, NE 68046
Estimated Value: $406,446 - $431,000
4
Beds
21
Baths
3,828
Sq Ft
$109/Sq Ft
Est. Value
About This Home
This home is located at 2211 S River Rock Dr, Papillion, NE 68046 and is currently estimated at $417,362, approximately $109 per square foot. 2211 S River Rock Dr is a home located in Sarpy County with nearby schools including Patriot Elementary School, Liberty Middle School, and Papillion La Vista South High School.
Ownership History
Date
Name
Owned For
Owner Type
Purchase Details
Closed on
Jul 24, 2018
Sold by
Fry Justin D and Fry Megan L
Bought by
Scrabeck David and Scrabeck Alissa D
Current Estimated Value
Home Financials for this Owner
Home Financials are based on the most recent Mortgage that was taken out on this home.
Original Mortgage
$216,800
Outstanding Balance
$187,890
Interest Rate
4.5%
Mortgage Type
New Conventional
Estimated Equity
$229,472
Purchase Details
Closed on
Aug 25, 2007
Sold by
Burke Thomas and Burke Mary L
Bought by
Fry Justin D and Fry Megan L
Home Financials for this Owner
Home Financials are based on the most recent Mortgage that was taken out on this home.
Original Mortgage
$218,400
Interest Rate
6.72%
Purchase Details
Closed on
Jun 23, 2006
Sold by
Hearthstone Homes Inc
Bought by
Burke Thomas and Burke Mary L
Home Financials for this Owner
Home Financials are based on the most recent Mortgage that was taken out on this home.
Original Mortgage
$180,173
Interest Rate
6.58%
Create a Home Valuation Report for This Property
The Home Valuation Report is an in-depth analysis detailing your home's value as well as a comparison with similar homes in the area
Home Values in the Area
Average Home Value in this Area
Purchase History
| Date | Buyer | Sale Price | Title Company |
|---|---|---|---|
| Scrabeck David | $271,000 | Dri Title & Escrow | |
| Fry Justin D | $230,000 | Slt | |
| Burke Thomas | $206,000 | Slt |
Source: Public Records
Mortgage History
| Date | Status | Borrower | Loan Amount |
|---|---|---|---|
| Open | Scrabeck David | $216,800 | |
| Previous Owner | Fry Justin D | $218,400 | |
| Previous Owner | Burke Thomas | $180,173 |
Source: Public Records
Tax History Compared to Growth
Tax History
| Year | Tax Paid | Tax Assessment Tax Assessment Total Assessment is a certain percentage of the fair market value that is determined by local assessors to be the total taxable value of land and additions on the property. | Land | Improvement |
|---|---|---|---|---|
| 2025 | $6,496 | $383,200 | $54,000 | $329,200 |
| 2024 | $7,169 | $374,973 | $50,000 | $324,973 |
| 2023 | $7,169 | $343,070 | $47,000 | $296,070 |
| 2022 | $6,977 | $306,151 | $42,000 | $264,151 |
| 2021 | $6,550 | $280,087 | $39,000 | $241,087 |
| 2020 | $6,265 | $268,262 | $36,000 | $232,262 |
| 2019 | $6,008 | $260,000 | $34,000 | $226,000 |
| 2018 | $5,895 | $252,059 | $32,000 | $220,059 |
| 2017 | $5,695 | $243,777 | $32,000 | $211,777 |
| 2016 | $5,543 | $235,050 | $25,000 | $210,050 |
| 2015 | $5,553 | $228,052 | $25,000 | $203,052 |
| 2014 | $5,316 | $217,635 | $25,000 | $192,635 |
| 2012 | -- | $212,591 | $25,000 | $187,591 |
Source: Public Records
Map
Nearby Homes
- 2208 S Mineral Dr
- 2110 S Mineral Dr
- 2010 Ridgeview Dr
- 2105 Petersen Dr
- 8904 Legacy St
- 501 Kent Dr
- 813 Clearwater Dr
- 2006 Diane St
- 8810 Legacy St
- 8716 Legacy St
- 8811 Legacy St
- Lot 115 Ave Unit Lot 115
- 8717 Legacy St Unit Lot 71
- 8713 Legacy St Unit Lot 70
- 514 Windsor Dr
- 8709 Legacy St Unit Lot 69
- 8705 Legacy St
- 8610 Legacy St
- 8606 Legacy St
- 2221 Placid Lake Dr
- 2213 S River Rock Dr
- 2209 S River Rock Dr
- 2207 S River Rock Dr
- 801 Stony Point Dr
- 2210 S River Rock Dr
- 2205 S River Rock Dr
- 803 Stony Point Dr
- 2208 S River Rock Dr
- 702 Summit Ridge Dr
- 704 Summit Ridge Dr
- 2206 S River Rock Dr
- 2203 S River Rock Dr
- 802 Summit Ridge Dr
- 805 Stony Point Dr
- 2209 S Mineral Dr
- 2207 S Mineral Dr
- 804 Summit Ridge Dr
- 2204 S River Rock Dr
- 2205 S Mineral Dr
- 2201 S River Rock Dr