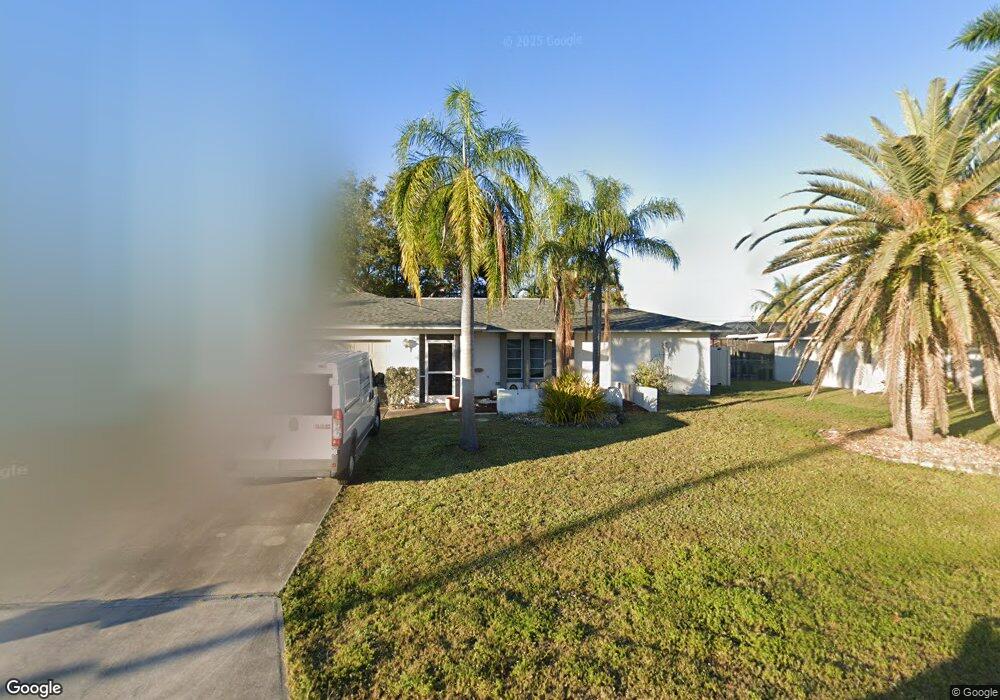
2211 SE 3rd St Unit 18 Cape Coral, FL 33990
Hancock NeighborhoodEstimated Value: $281,870 - $378,000
3
Beds
2
Baths
1,988
Sq Ft
$164/Sq Ft
Est. Value
About This Home
This home is located at 2211 SE 3rd St Unit 18, Cape Coral, FL 33990 and is currently estimated at $326,718, approximately $164 per square foot. 2211 SE 3rd St Unit 18 is a home located in Lee County with nearby schools including Tropic Isles Elementary School, Hancock Creek Elementary School, and Caloosa Elementary School.
Ownership History
Date
Name
Owned For
Owner Type
Purchase Details
Closed on
May 16, 2014
Sold by
Larkin Tara Beth
Bought by
Larkin Joseph J
Current Estimated Value
Purchase Details
Closed on
Dec 20, 2010
Sold by
Fbd Ventures Llc
Bought by
Larkin Joseph J
Home Financials for this Owner
Home Financials are based on the most recent Mortgage that was taken out on this home.
Original Mortgage
$99,901
Outstanding Balance
$67,760
Interest Rate
4.75%
Mortgage Type
FHA
Estimated Equity
$258,958
Purchase Details
Closed on
Jul 20, 2010
Sold by
Griffin Martha
Bought by
Fbd Ventures Llc
Purchase Details
Closed on
Dec 1, 2009
Sold by
Griffin Martha and Heimer Troy L
Bought by
Griffin Martha
Purchase Details
Closed on
Jun 10, 2005
Sold by
Payne Betsy K and Payne James E
Bought by
Heimer Troy L and Griffin Martha
Create a Home Valuation Report for This Property
The Home Valuation Report is an in-depth analysis detailing your home's value as well as a comparison with similar homes in the area
Home Values in the Area
Average Home Value in this Area
Purchase History
| Date | Buyer | Sale Price | Title Company |
|---|---|---|---|
| Larkin Joseph J | -- | Attorney | |
| Larkin Joseph J | $102,500 | Florida Title One Llc | |
| Fbd Ventures Llc | $68,200 | None Available | |
| Griffin Martha | -- | None Available | |
| Heimer Troy L | $225,000 | Bay Title Services |
Source: Public Records
Mortgage History
| Date | Status | Borrower | Loan Amount |
|---|---|---|---|
| Open | Larkin Joseph J | $99,901 |
Source: Public Records
Tax History Compared to Growth
Tax History
| Year | Tax Paid | Tax Assessment Tax Assessment Total Assessment is a certain percentage of the fair market value that is determined by local assessors to be the total taxable value of land and additions on the property. | Land | Improvement |
|---|---|---|---|---|
| 2025 | $1,646 | $92,636 | -- | -- |
| 2024 | $1,528 | $90,025 | -- | -- |
| 2023 | $1,528 | $87,403 | $0 | $0 |
| 2022 | $1,352 | $84,857 | $0 | $0 |
| 2021 | $1,286 | $162,662 | $24,000 | $138,662 |
| 2020 | $1,268 | $81,248 | $0 | $0 |
| 2019 | $1,215 | $79,421 | $0 | $0 |
| 2018 | $1,191 | $77,940 | $0 | $0 |
| 2017 | $1,169 | $76,337 | $0 | $0 |
| 2016 | $1,114 | $122,111 | $16,000 | $106,111 |
| 2015 | $1,098 | $107,498 | $13,000 | $94,498 |
| 2014 | $1,039 | $102,011 | $9,024 | $92,987 |
| 2013 | -- | $85,206 | $7,800 | $77,406 |
Source: Public Records
Map
Nearby Homes
- 2220 SE 2nd Terrace
- 2303 SE 3rd St
- 2309 SE 3rd St
- 2105 SE 2nd Terrace
- 118 SE 23rd Place
- 315 SE 24th Ave
- 217 SE 24th Ave
- 2102 Bolado Pkwy
- 236 SE 20th Ct
- 508 SE 23rd Place
- 502 SE 24th Ave
- 207 SE 20th Place
- 508 SE 24th Ave
- 5905 Untermeyer Ct
- 615 SE 23rd Place
- 1922 SE 5th St Unit 18
- 516 SE 20th Place
- 2113 Lochmoor Cir Unit 4
- 4380 Saint Clair Ave W
- 4344 Saint Clair Ave W
- 2207 SE 3rd St
- 2215 SE 3rd St
- 2212 SE 2nd Terrace
- 2216 SE 2nd Terrace
- 2208 SE 2nd Terrace
- 2203 SE 3rd St
- 2217 SE 3rd St
- 2212 SE 3rd St
- 2208 SE 3rd St
- 2204 SE 2nd Terrace Unit 18
- 2216 SE 3rd St
- 2204 SE 3rd St
- 2220 SE 3rd St
- 2223 SE 3rd St
- 2129 SE 3rd St
- 2132 SE 2nd Terrace
- 2130 SE 3rd St
- 2224 SE 2nd Terrace
- 2209 SE 3rd Terrace
- 2209 SE 2nd Terrace