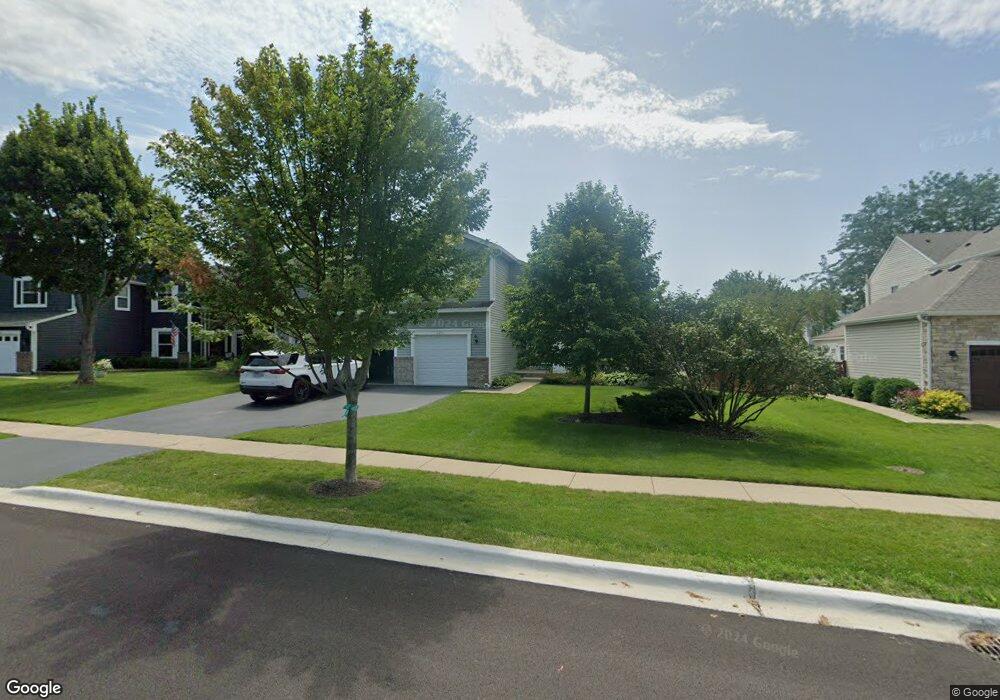
2211 Somerset Ln Mundelein, IL 60060
Town and Country NeighborhoodEstimated Value: $486,000 - $650,000
3
Beds
3
Baths
2,442
Sq Ft
$227/Sq Ft
Est. Value
About This Home
This home is located at 2211 Somerset Ln, Mundelein, IL 60060 and is currently estimated at $554,239, approximately $226 per square foot. 2211 Somerset Ln is a home located in Lake County with nearby schools including Fremont Elementary School, Fremont Intermediate School, and Fremont Jr High/Middle School.
Ownership History
Date
Name
Owned For
Owner Type
Purchase Details
Closed on
Feb 9, 2009
Sold by
Ellis Paul A and Padalino Teresa
Bought by
Ellis Paul A and Ellis Teresa A
Current Estimated Value
Home Financials for this Owner
Home Financials are based on the most recent Mortgage that was taken out on this home.
Original Mortgage
$319,500
Outstanding Balance
$199,901
Interest Rate
4.91%
Mortgage Type
New Conventional
Estimated Equity
$354,338
Purchase Details
Closed on
Dec 10, 2006
Sold by
Small Troy D and Wyatt Small Christa R
Bought by
Ellis Paul A and Padalino Teresa
Home Financials for this Owner
Home Financials are based on the most recent Mortgage that was taken out on this home.
Original Mortgage
$323,000
Interest Rate
6.71%
Mortgage Type
Purchase Money Mortgage
Purchase Details
Closed on
Oct 3, 2003
Sold by
National Residential Nominee Svcs Inc
Bought by
Small Troy D and Wyatt Small Christa R
Home Financials for this Owner
Home Financials are based on the most recent Mortgage that was taken out on this home.
Original Mortgage
$309,150
Interest Rate
6.02%
Mortgage Type
Purchase Money Mortgage
Purchase Details
Closed on
Sep 9, 2003
Sold by
Turner Charles D and Turner Deborah W
Bought by
National Residential Nominee Svcs Inc
Home Financials for this Owner
Home Financials are based on the most recent Mortgage that was taken out on this home.
Original Mortgage
$309,150
Interest Rate
6.02%
Mortgage Type
Purchase Money Mortgage
Purchase Details
Closed on
Nov 16, 2001
Sold by
Gu Zhijie and Gu John
Bought by
Turner Charles D and Turner Deborah W
Home Financials for this Owner
Home Financials are based on the most recent Mortgage that was taken out on this home.
Original Mortgage
$200,000
Interest Rate
4%
Purchase Details
Closed on
Jun 24, 1999
Sold by
Flasch Gregory W and Flasch Grace
Bought by
Gu Zhijie
Home Financials for this Owner
Home Financials are based on the most recent Mortgage that was taken out on this home.
Original Mortgage
$247,000
Interest Rate
6.87%
Purchase Details
Closed on
Jul 24, 1998
Sold by
Yee George W and Yee Amy
Bought by
Flasch Gregory W and Flasch Grace
Home Financials for this Owner
Home Financials are based on the most recent Mortgage that was taken out on this home.
Original Mortgage
$185,000
Interest Rate
7.05%
Purchase Details
Closed on
Dec 10, 1995
Sold by
Harris Bank Hinsdale
Bought by
Yee George W and Yee Amy
Home Financials for this Owner
Home Financials are based on the most recent Mortgage that was taken out on this home.
Original Mortgage
$210,000
Interest Rate
7.06%
Create a Home Valuation Report for This Property
The Home Valuation Report is an in-depth analysis detailing your home's value as well as a comparison with similar homes in the area
Home Values in the Area
Average Home Value in this Area
Purchase History
| Date | Buyer | Sale Price | Title Company |
|---|---|---|---|
| Ellis Paul A | -- | First American Title | |
| Ellis Paul A | $340,000 | 1St American Title | |
| Small Troy D | $343,500 | -- | |
| National Residential Nominee Svcs Inc | $343,500 | -- | |
| Turner Charles D | $304,000 | -- | |
| Gu Zhijie | $260,000 | Ticor Title | |
| Flasch Gregory W | $235,000 | -- | |
| Yee George W | $221,500 | Chicago Title Insurance Co |
Source: Public Records
Mortgage History
| Date | Status | Borrower | Loan Amount |
|---|---|---|---|
| Open | Ellis Paul A | $319,500 | |
| Previous Owner | Ellis Paul A | $323,000 | |
| Previous Owner | Small Troy D | $309,150 | |
| Previous Owner | Turner Charles D | $200,000 | |
| Previous Owner | Gu Zhijie | $247,000 | |
| Previous Owner | Flasch Gregory W | $185,000 | |
| Previous Owner | Yee George W | $210,000 | |
| Closed | Small Troy D | $17,100 |
Source: Public Records
Tax History Compared to Growth
Tax History
| Year | Tax Paid | Tax Assessment Tax Assessment Total Assessment is a certain percentage of the fair market value that is determined by local assessors to be the total taxable value of land and additions on the property. | Land | Improvement |
|---|---|---|---|---|
| 2024 | $10,340 | $132,714 | $32,909 | $99,805 |
| 2023 | $10,023 | $121,600 | $30,153 | $91,447 |
| 2022 | $10,023 | $115,264 | $31,079 | $84,185 |
| 2021 | $9,580 | $111,226 | $29,990 | $81,236 |
| 2020 | $9,605 | $108,165 | $29,165 | $79,000 |
| 2019 | $9,284 | $104,608 | $28,206 | $76,402 |
| 2018 | $9,306 | $105,978 | $28,145 | $77,833 |
| 2017 | $9,208 | $102,642 | $27,259 | $75,383 |
| 2016 | $8,997 | $97,485 | $25,889 | $71,596 |
| 2015 | $8,834 | $91,389 | $24,270 | $67,119 |
| 2014 | $8,508 | $88,556 | $23,089 | $65,467 |
| 2012 | $8,581 | $89,342 | $23,294 | $66,048 |
Source: Public Records
Map
Nearby Homes
- 2301 Fieldcrest Dr
- 2330 Somerset Ln
- 2607 Martini St
- 2599 Martini St Unit 2599
- 2732 Fieldcrest Dr
- 1300 Kettering Rd
- 28884 N Il Route 83
- 3209 Martini St
- 1329 Turnberry Ln
- 1010 Evergreen St Unit 3
- Abbeyville Plan at Sheldon Woods - Meadows
- 3170 Semple Way
- Continental Plan at Sheldon Woods - Meadows
- Newberry Plan at Sheldon Woods - Meadows
- Mercer Plan at Sheldon Woods - Meadows
- 3180 Semple Way
- 1730 Savannah Cir
- 1497 Kessler Dr
- 1217 Kessler Dr
- 1207 Kessler Dr
- 2221 Somerset Ln Unit 2
- 2201 Somerset Ln
- 2220 Fieldcrest Dr
- 2210 Fieldcrest Dr
- 2131 Somerset Ln Unit 2
- 2231 Somerset Ln
- 2230 Fieldcrest Dr Unit 2
- 2200 Fieldcrest Dr
- 2210 Somerset Ln
- 2220 Somerset Ln Unit 2
- 2200 Somerset Ln
- 2130 Fieldcrest Dr
- 2300 Fieldcrest Dr Unit 2
- 2230 Somerset Ln
- 2301 Somerset Ln
- 2120 Somerset Ln
- 2121 Somerset Ln
- 2240 Somerset Ln
- 2120 Fieldcrest Dr
- 2310 Fieldcrest Dr